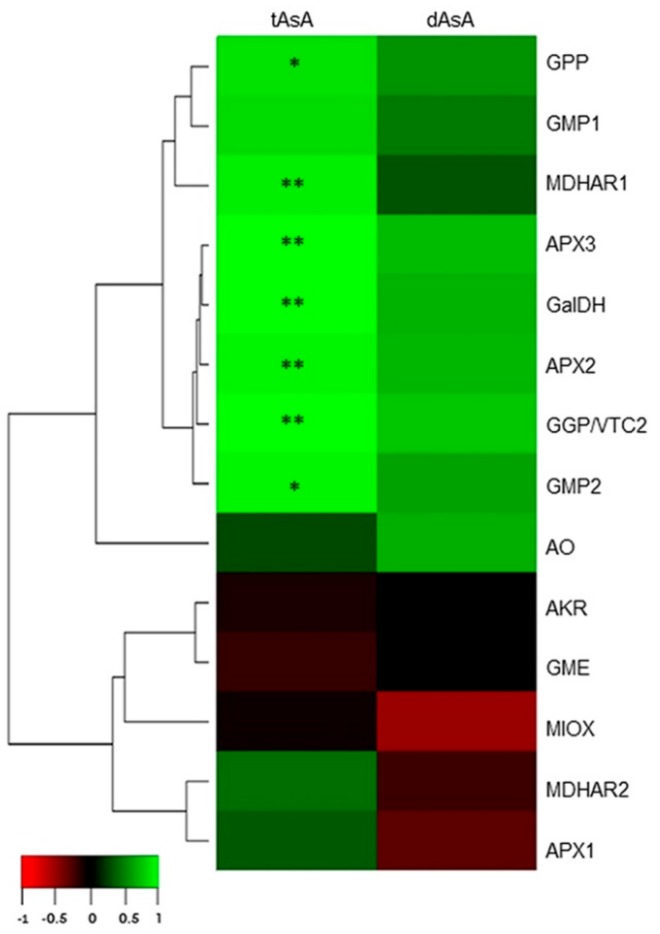
Figure 6.
Heatmap of the correlations between gene expression states and tAsA or dAsA in pepper fruits. Gradation from red to green represents negative from positive correlations according to the color scale at the bottom. Asterisks indicate a statistical significant correlation (*: p < 0.05; **: p < 0.01).

