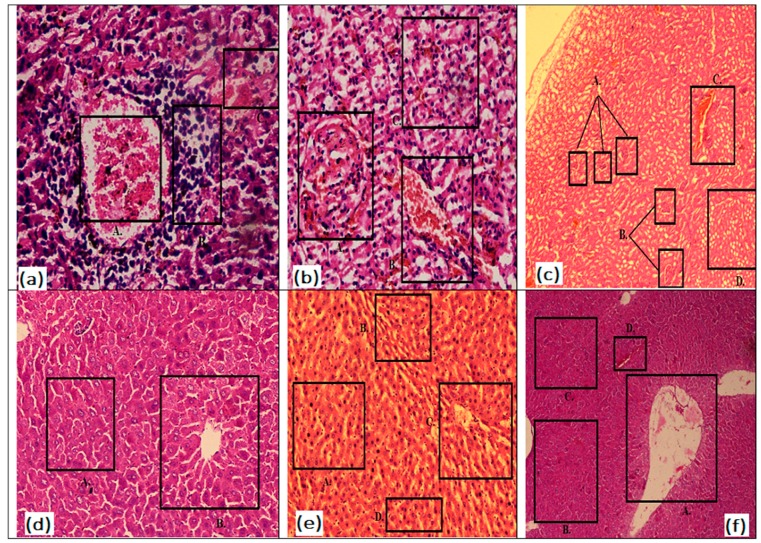
Figure 4.
Photomicrographs of diabetic mice kidney and liver treated with Mangifera indica extract. Here, disease control kidney, standard therapy kidney, 950 mg/kg extract treated rat kidney, normal control liver, liver of diabetic mice treated with 550 and 950 mg/kg extracts are shown by (a–f) respectively. Where glomeruli are shown by boxes in (a), (b) and (c), whereas boxes show normal hepatocytes in (d), pyknosis in (e) and central vein in (f) respectively.

