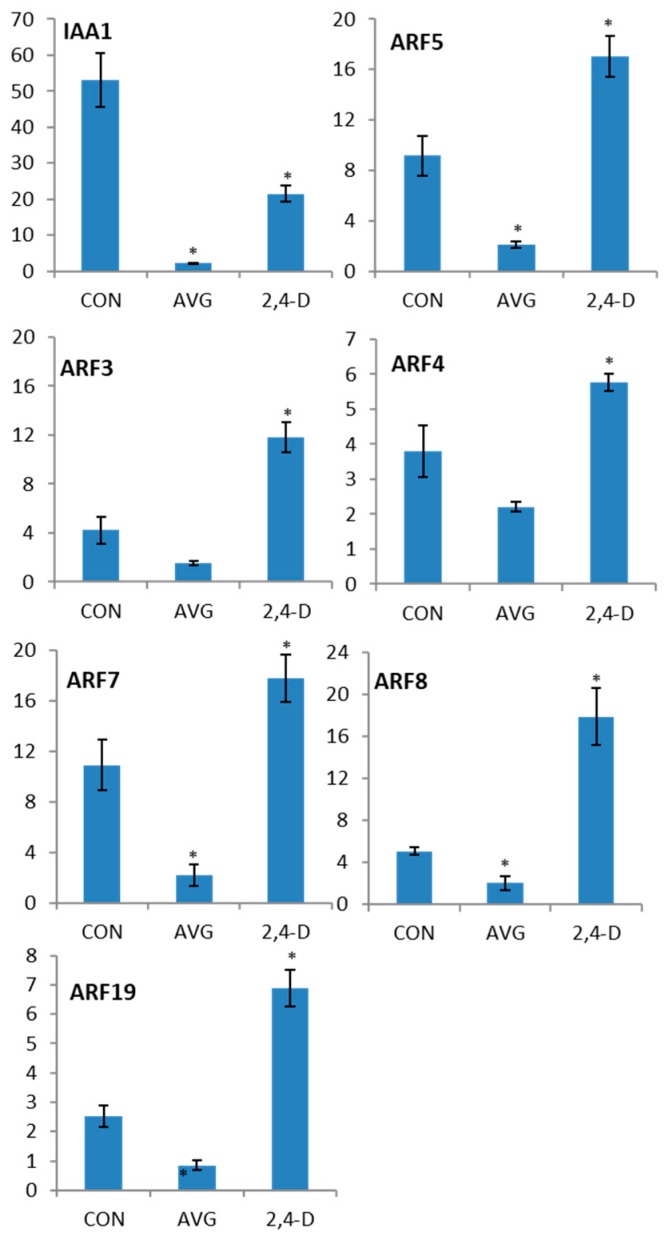
Figure 5.
Auxin regulation of ARF gene transcript levels. The left bar indicates expression in untreated control seedlings, the middle bar indicates expression in seedlings after a 28 h AVG treatment, and the right bar 28-h AVG treatment followed by 4 h of 2,4-D treatment. All values on the y axes are expressed in terms of transcript abundance relative to the control gene APT1. IAA1 is used as a positive control based on well-known auxin inducibility. Student’s T-test, significant p-values (<0.05) are indicated by asterisks. Error bars represent standard deviations.

