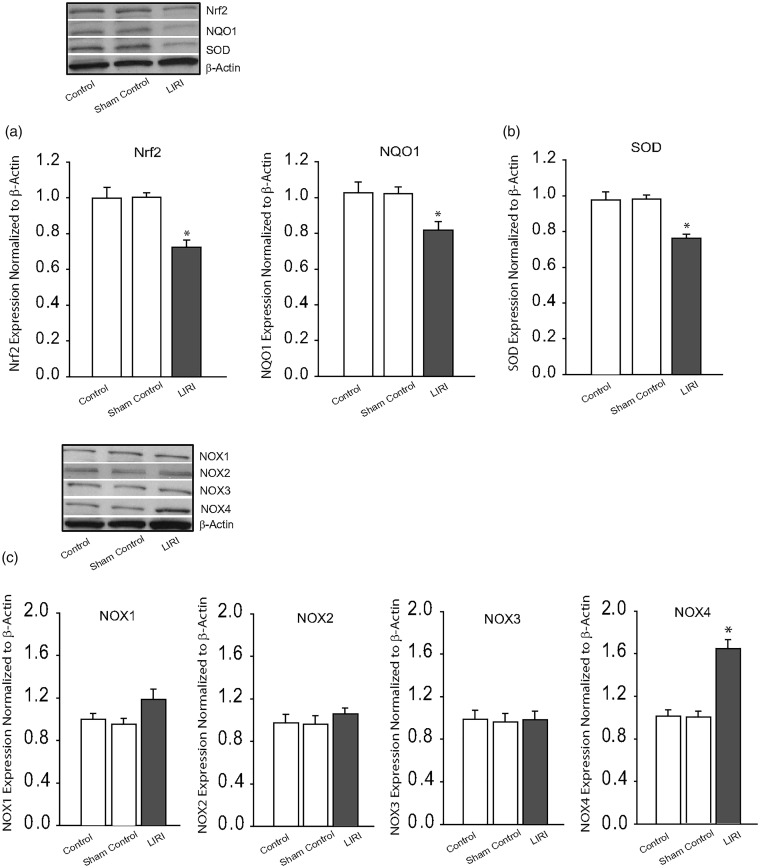
Fig. 2.
Effects of LIRI on antioxidant response and oxidative stress signal pathways. (a and b): Protein expression levels of Nrf2-ARE and SOD. Top panel and bottom panel are representative bands and averaged data: Nrf2/NQO1 and SOD were decreased in the cNTS of LIRI rats. *P < 0.05, LIRI rats versus control rats and sham control rats. n = 6–12 in each group. Insignificant difference was seen between control rats and sham control rats (P > 0.05). (c) Representative bands and averaged data showing that protein expression levels of NOX1, NOX2, and NOX3 were not altered significantly by LIRI, but NOX4 was amplified by LIRI. *P < 0.05, LIRI rats versus control rats and sham control rats. n = 6–10 in each group. Insignificant difference was seen between control rats and sham control rats (P > 0.05). SOD: superoxide dismutase.

