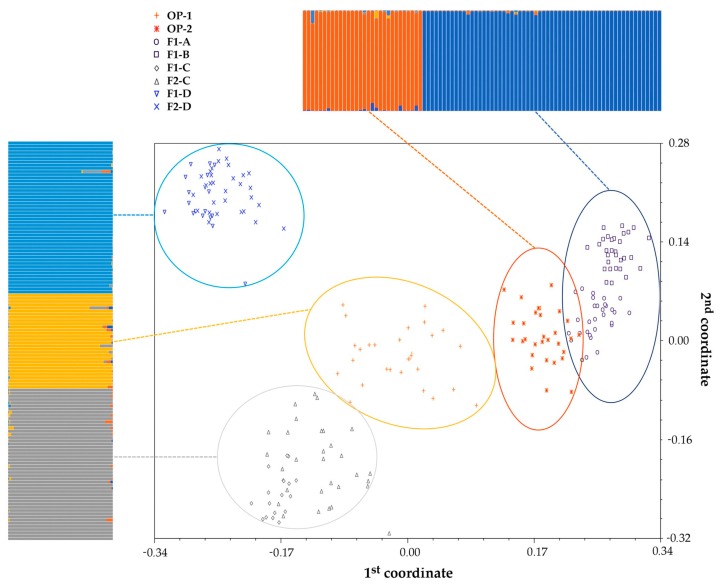
Figure 2.
Principal coordinate analysis (PCoA). The centroids of all radicchio samples (n = 216) deriving from the mean genetic similarity coefficients plotted according to the first two main coordinates. For each population, the PCoA output is coupled with the results of the population genetic structure study, estimated by STRUCTURE software using the same SSR marker data set. Each sample is represented by a vertical histogram partitioned into K = 5 coloured segments that report the estimated membership.

