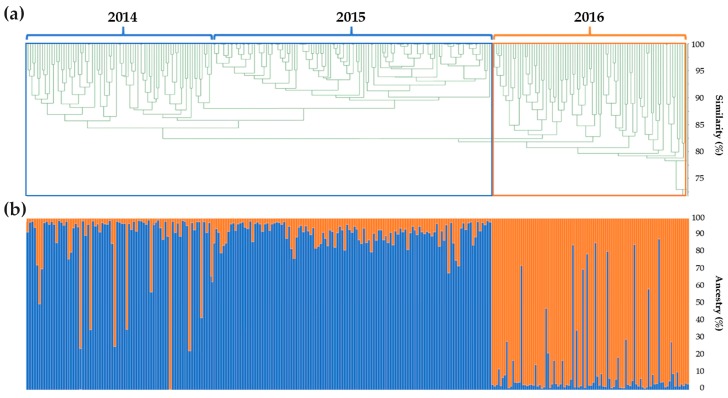
Figure 4.
Analysis of the genetic structure of the 3 years of seed production of the F1 hybrid variety analyzed. (a) Unweighted pair group method with arithmetic mean (UPGMA) dendrogram, based on the calculated genetic similarity among individuals of years 2014, 2015 and 2016. Blue and orange squares highlight the two main identified clusters. (b) STRUCTURE software results. Data are disposed of in a vertical histogram, labelled for K = 2 colours concerning cluster membership of each individual sample belonging to years 2014, 2015 or 2016.

