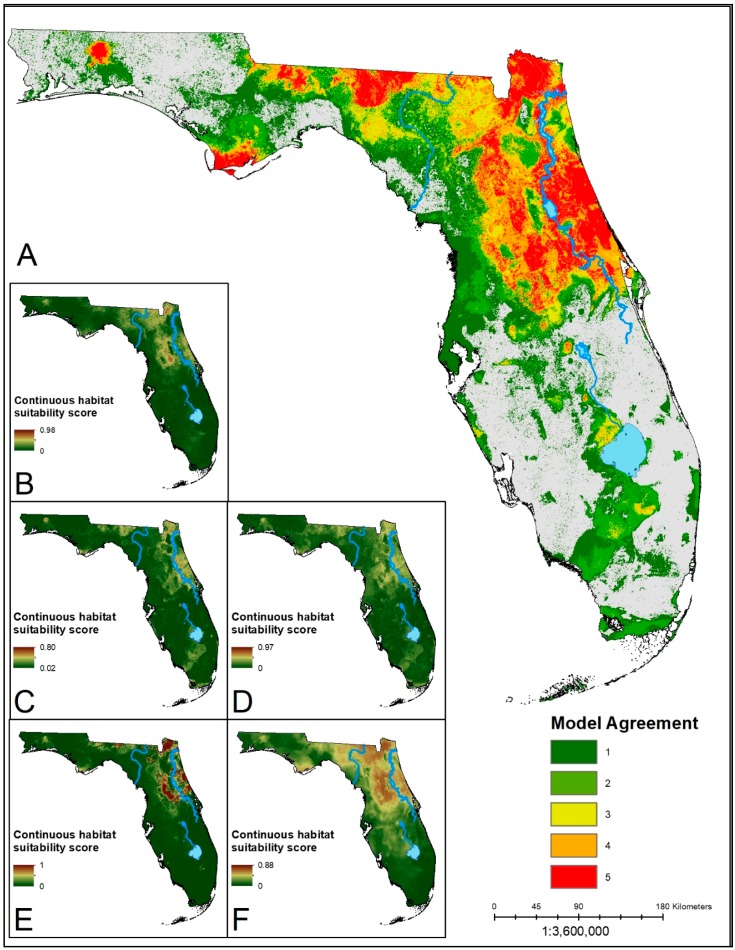
Figure 2.
(A) Ensemble prediction of suitable habitat for I. scapularis. Hotter colors indicate higher agreement on habitat suitability across models for a given area. (B–F) Continuous suitability scores for the five modeling algorithms: LR, BRT, RF, MARS, MaxEnt, respectively. Much of the northeastern part of the state is deemed suitable by the majority of the models. Southern areas of predicted suitability show lower consensus.

