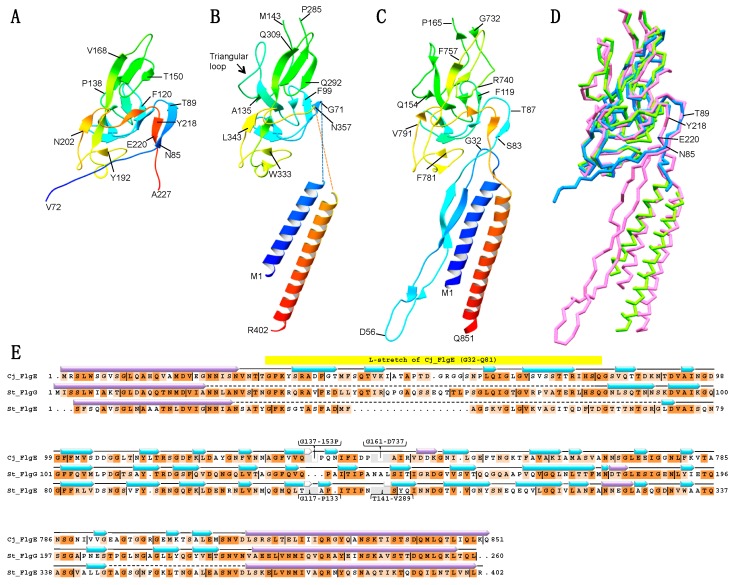
Figure 1.
Structure of a core fragment of St-FlgG (FlgG20) from Salmonella typhimurium (St), FlgE from Salmonella typhimurium and FlgE from Campylobacter jejuni (Cj). Ribbon representation of the crystal structure of FlgG20 (A), the cryoEM structure model of D0 and D1 domains of St-FlgE (PDB ID: 3A69) (B), and the cryoEM structure of D0, l-stretch and D1 of Cj-FlgE (PDB ID: 5JXL) (C). The Dc region of the St-FlgE structure is not modeled due to the low resolution of the cryoEM map in (B). The models are color-coded from blue to red through the rainbow spectrum from the N to C terminus. (D) The superimposition of backbone models of FlgG20 (blue), St-FlgE (green) and Cj-FlgE (pink). The positions of N85, T89, Y218 and T221 of FlgG20 are indicated. (E) Structure-based sequence alignment of Cj-FlgG, St-FlgG and St-FlgE. Conserved residues are highlighted in dark orange (identical residues) or light orange (similar residues). Purple and cyan arrow indicates α-helix and β-strand, respectively. Molecular figures were drawn using MolFeat (Ver 3.6, FiatLux Corporation).

