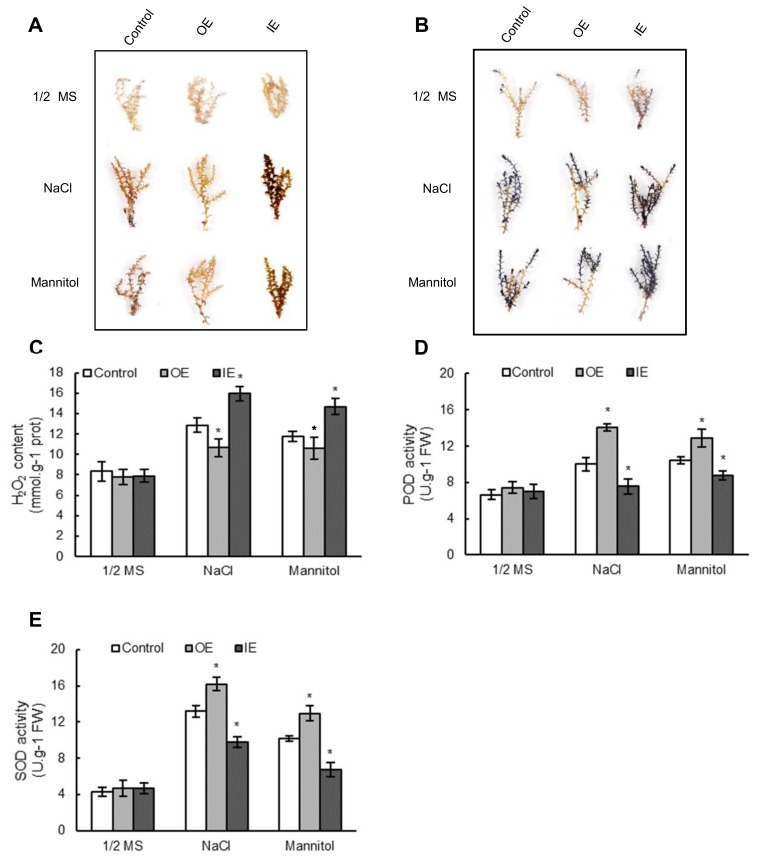
Figure 5.
Analysis of ROS accumulation and the activities of SOD and POD among OE, IE, and control T. hispida plants. (A,B): T. hispida plants treated with NaCl (150 Mm) or mannitol (200 mM), and stained with DAB to visualise H2O2 level (A), or stained with NBT to visualise O2− (B). (C): Measurement of H2O2 levels in T. hispida. (D,E): Measurement of the POD (D) and SOD (E) activity. OE: T. hispida plants overexpressing ThNAC7; IE: ThNAC7 RNAi-silenced T. hispida seedlings; Control: T. hispida plants transformed with pROKII.

