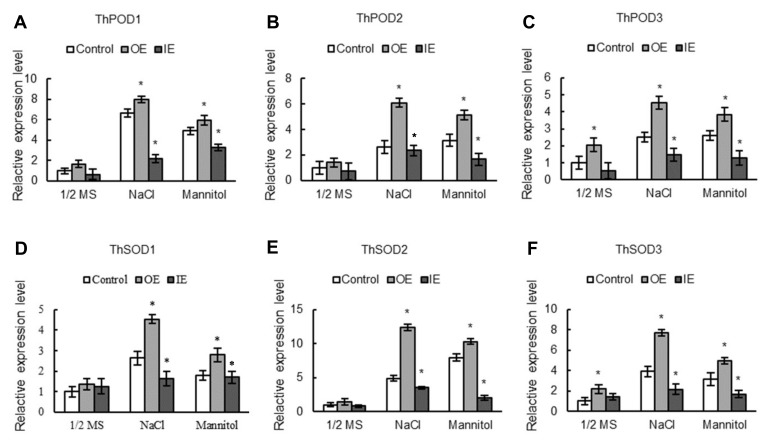
Figure 6.
The expression patterns of the PODs and SODs in OE, IE, and control T. hispida seedlings. The expression of PODs (A) and SODs (B) were analyzed in control, OE, and IE T. hispida in response to salt (150 mM NaCl) or osmotic (200 mM mannitol) stress. The transcription level of a gene in control under normal growth conditions was designed as 1 to standardize its relative expression values. OE: T. hispida seedlings overexpressed ThNAC7; IE: ThNAC7 RNAi-silenced T. hispida seedlings; Control: T. hispida seedlings transformed with pROKII. * Significant (p < 0.05) difference compared to the control plants.

