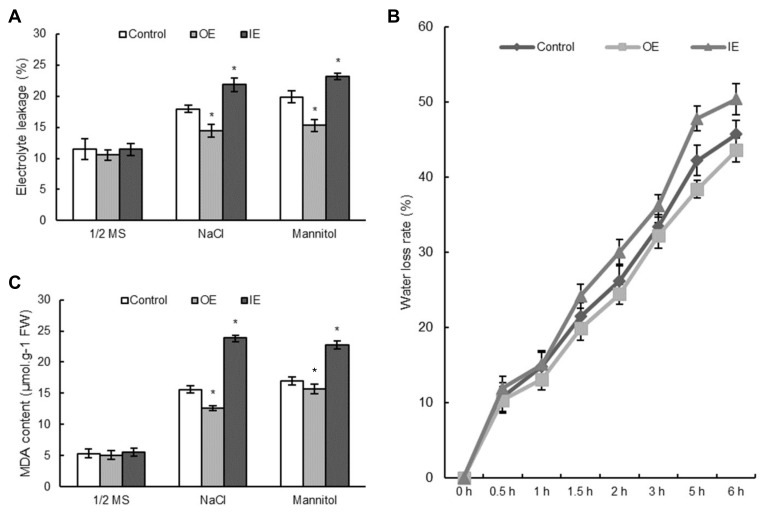
Figure 7.
Detection of cell death, water loss rates, and MDA level in OE, IE, and control T. hispida seedlings. (A): Electrolyte leakage rates assay. (B): Water loss rates. (C): MDA content. The T. hispida plants were treated with H2O (as control), NaCl (150 mM), or mannitol (200 mM) for 24 h. Data are means ± SD from 3 independent experiments. * Significant (p < 0.05) difference compared to the control. OE: T. hispida overexpressing ThNAC7; IE: ThNAC7 RNAi-silenced T. hispida; Control: T. hispida plants transformed with pROKII.

