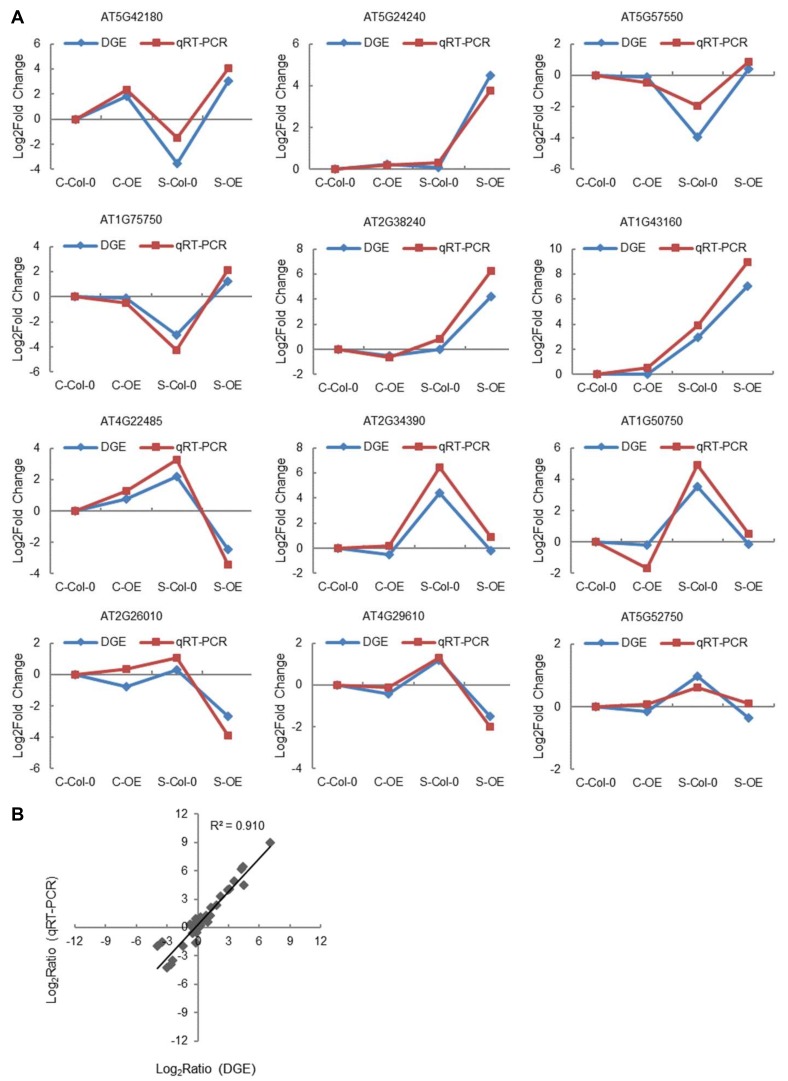
Figure 9.
Comparison of the expression patterns between RNA-seq and qRT-PCR. A: Twelve highly differentially regulated genes were randomly selected for qRT-PCR assay. B: Correlation: correlation analysis of the results between qRT-PCR and RNA-sequencing; the correlation coefficient R2 is 0.910. * Significant (p < 0.05) difference compared with the control plants.

