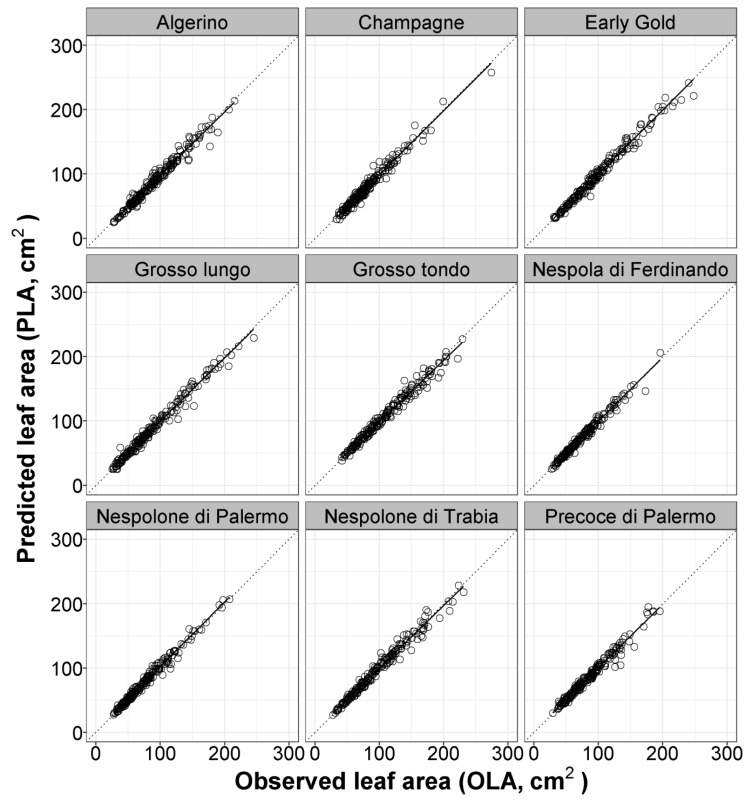
Figure 1.
Plots of predicted leaf area (PLA) using model 7 [LA = −0.516 + 0.667 × (L × W)], obtained with pooled data of nine different loquat cultivars, versus observed values of single leaf areas (OLA) of each cultivar used in the calibration experiment (data collected during 2015). Dotted lines represent the 1:1 relationship between the predicted and observed values. The solid line represents the linear regression line of each model.

