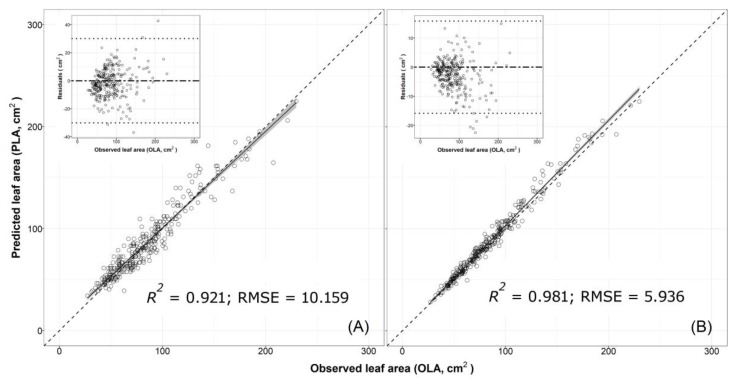
Figure 2.
Plot of predicted leaf area (PLA) estimated using (A) one-regressor bootstrapped model 6 [LA = 14.003 + 1.742 × W2] and (B) two-regressors bootstrapped model 7 [LA = −0.526 + 0.667 × (L × W)] versus observed values of single leaf areas (OLA) of cv. ‘Tanaka’ collected during 2016 (validation experiment). The solid line and the grey area represent, respectively, linear regression lines of the bootstrapped models 6 and 7 and generalised linear smoothing. R2 and root mean squared error (RMSE) are also reported. Dotted lines represent the 1:1 relationship between the predicted and observed values. The analysis of the dispersion pattern of residuals for models 6 and 7 are shown in the insets. Residuals = the difference between predicted leaf areas (PLA) estimated by model 6 or 7 (with coefficients obtained from pooled data from nine loquat cultivars, see Table 4 for more details) versus the observed leaf area of ‘Tanaka’ cultivar sampled in 2016 (validation experiment). The solid line is the mean of the differences. The broken lines are the limits of agreement, calculated as d ± 3 SD (standard deviation); where d is the mean of the differences, and SD is the standard deviation of the differences. If the differences are normally distributed, 97% of the differences in a population will lie between the limits of agreement.

