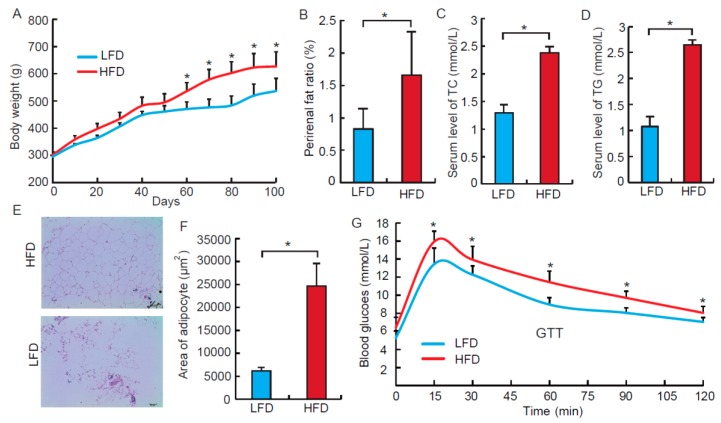
Figure 1.
High fat diet induces obese rat model. (A) The body weight of Strague Dawley (SD) rats that were fed with normal chow and high fat diet, n = 8. (B) The ratio of perirenal fat to body weight in the low fat diet (LFD) and the high fat diet (HFD) groups, n = 8. (C,D) The concentration of serum cholesterol (TC) and triglyceride (TG) in the LFD and HFD group, n = 8. (E) HE staining of perirenal fat from normal and obese SD rats, n = 3. Scale bar = 100 μm. (F) The average adipocyte area of perirenal fat from normal and obese SD rats, n = 3. (G) The blood glucose concentration of rats after an intravenous glucose tolerance test (i.v. test of glucose tolerance (GTT)), n = 8. All data were presented as means ± standard deviation. * p < 0.05.

