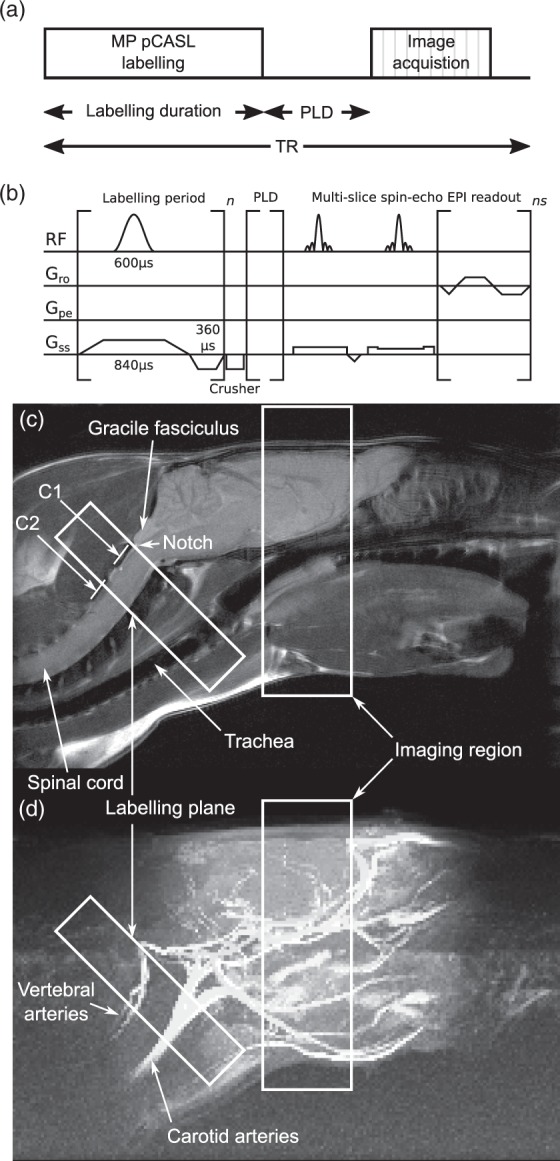
Figure 1.

(a) Schematic of the multiphase pCASL sequence. (b) Pulse timing diagram of the sequence. (c and d) Location of the labelling and imaging regions shown in relation to the brain and the major vessels of the neck, superimposed over (c) an anatomical, fast spin-echo sagittal midline image of an SD rat head, and (d) a maximum intensity projection of time-of-flight angiography with the same field of view. Positions of C1 and C2 vertebra are visible and the notch immediately caudal to the gracile fasciculus is easily identified.
