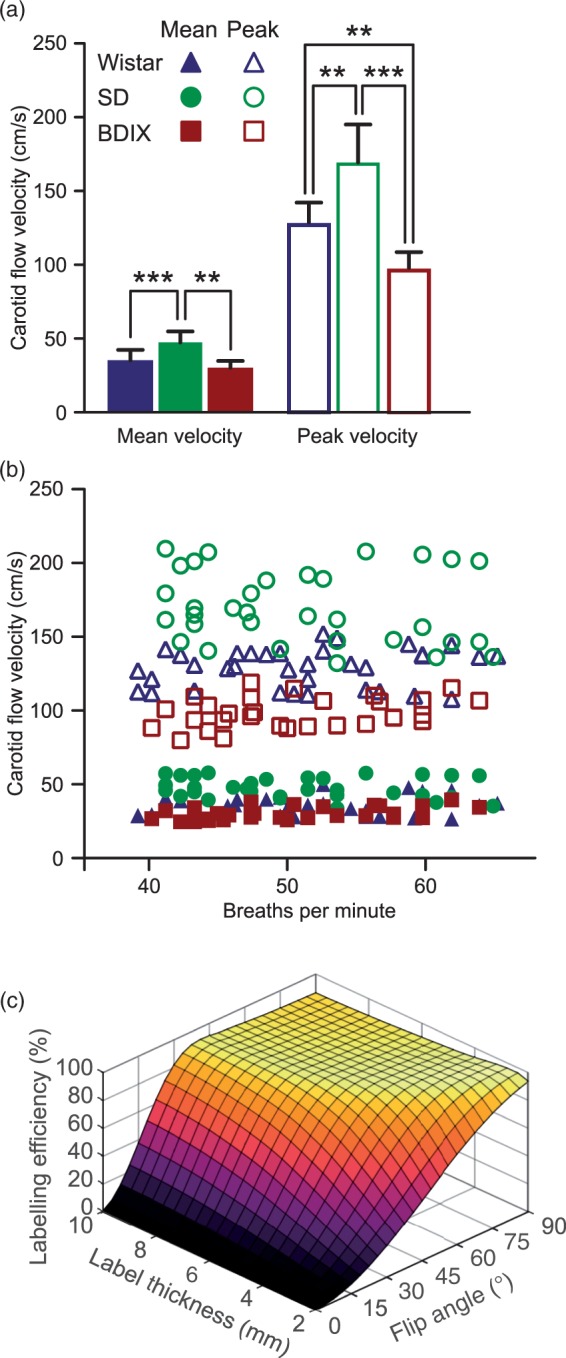
Figure 3.

(a) Mean and peak carotid artery flow velocities in three strains of rats; Wistar, SD and BDIX. (b) Mean and peak carotid artery flow velocities as a function of anaesthetic depth, as indicated by breathing rate. (c) Bloch simulation results showing labelling efficiency (inversion achieved as a percentage of theoretical inversion possible), for blood as it passes through labelling planes of 2–10 mm thickness with flip angles in the labelling pulse train between 2° and 90° at 37 cm/s (mean carotid velocity for all rats studied).
