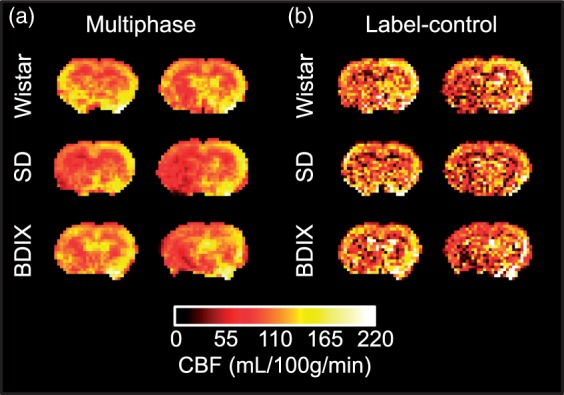
Figure 6.

Comparison of CBF maps from single-average multiphase pCASL acquisitions and four-average label-control acquisitions in the same animal; total imaging time 89 s in each case. Note the lower CBF values, areas of greater heterogeneity and the regions with decreased apparent perfusion in the label-control maps.
