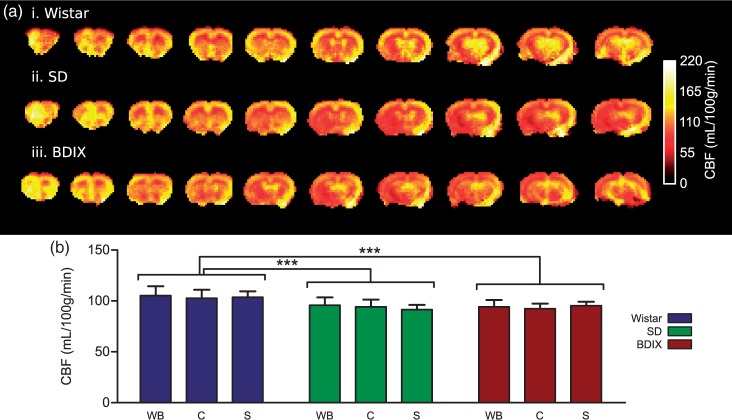
Figure 7.
(a) Example cerebral blood flow maps acquired using the optimised multiphase pCASL sequence for three strains of rat; Wistar, SD and BDIX. Eight averages were acquired per image, total imaging time = 11 min 52 s. (b) CBF mean of whole brain (WB), cortex (c), and striatum (S) in three strains of rats. n = 7 rats/strain; *p < 0.05.

