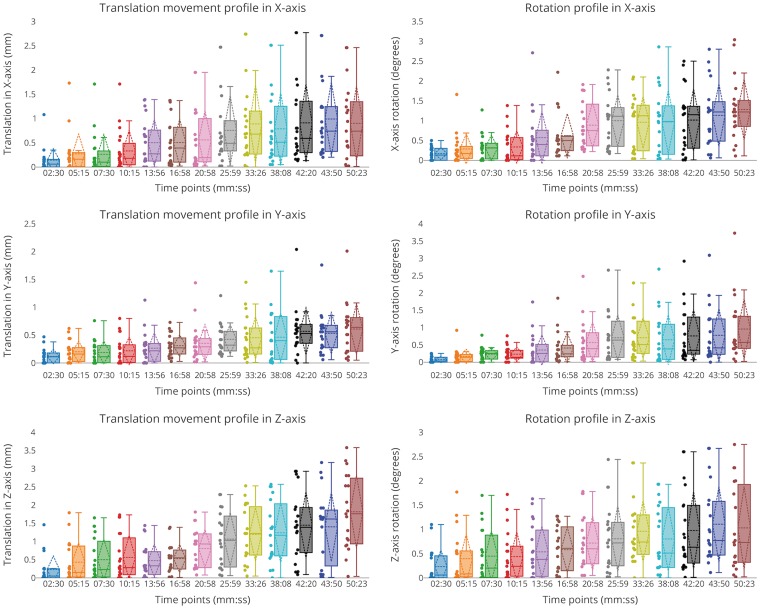
Figure 2.
Translation (left) and rotation (right) profiles in each axis with respect to examination time (Supplementary Figure 1) for 20 datasets. Subject motion (translation and rotation) increased with time and subject translation was prominent in the z-axis. It is seen that the motion was minimal during the first 10 min of the scan (maximum translation < 2 mm, average rotation < 1 and maximum rotation < 2°).

