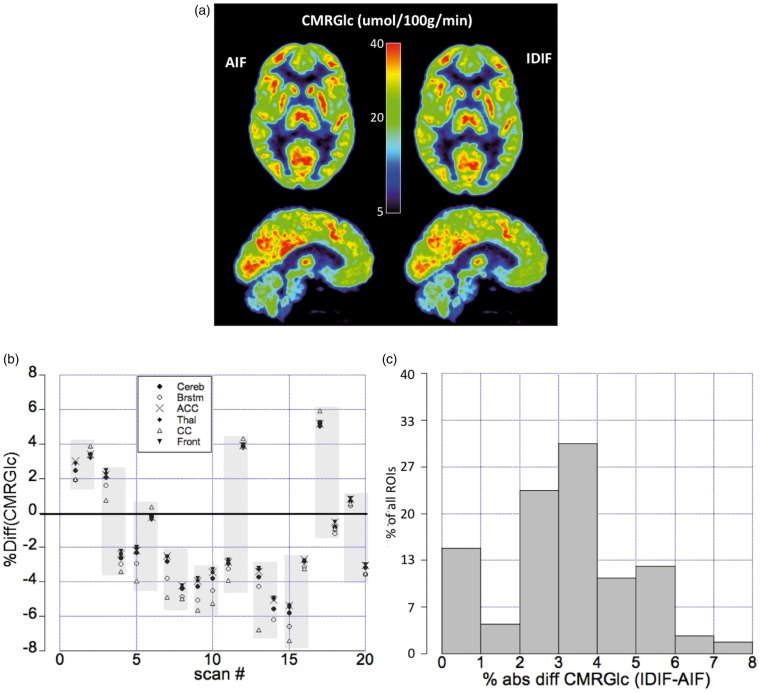
Figure 6.
(a) Transaxial (top row) and sagittal (bottom row) images representing CMRGlc derived using the AIF (left) and the IDIF (right) for a subject with a 3% AUC overestimation by IDIF. Images show excellent agreement in absolute CMRGlc values. (b)Relative %-differences for six reference regions (cerebellum, brainstem, anterior cingulate cortex, thalamus, corpus callosum and superior frontal cortex) in all 20 scans. The shaded areas depict test/retest scans obtained in the same subject. (c)Histogram depicting the % absolute differences in CMRGlc values derived using the IDIF and the AIF. The graph shows a maximum for difference values in the range of 2–4%, with 85% of all differences laying within 5%.

