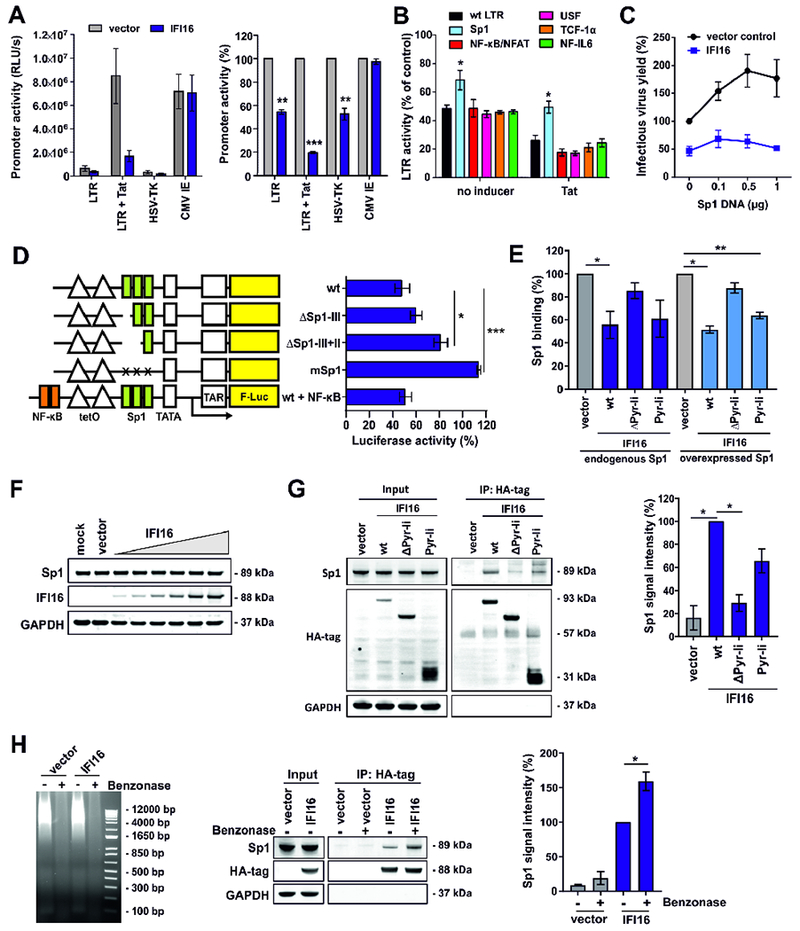
Figure 5. IFI16 inhibits HIV-1 LTR activity in a Tat and Sp1 dependent manner.

(A) HEK293T cells were cotransfected with luciferase reporter constructs under the control of the indicated promoters and expression constructs for IFI16 or a vector control. A construct expressing NL4-3 Tat under the control of the CMV IE promoter was used to activate the LTR. The left panel shows absolute luciferase values and the right panel values measured in the presence of IFI16 relative to the vector control (100%). All panels show mean values (±SEM) obtained in three to four experiments. * p <0.05, ** p < 0.01, *** p <0.001.
(B) Effect of IFI16 on mutant HIV-1 LTRs. Values represent mean luciferase activities (±SEM, n=4) of LTR reporter constructs with inactivating mutations in the indicated transcription factor binding sites in the presence of IFI16 relative to the vector control (100 %) as described for (A).
(C) HEK293T cells were cotransfected with expression constructs for Sp1, proviral HIV-1 NL4-3 constructs (2.5 μg), and constructs for IFI16 or the vector control (1 μg). 40 h post-transfection infectious virus yield was determined by infection of TZM-b1 cells. Values were normalized to infectious virus yield in the absence of Sp1 and IFI16 (100%).
(D) HEK293T cells were cotransfected with doxycycline-dependent firefly luciferase reporter constructs under the control of minimal wt or mutant LTRs, CMV IE-dependent Gaussia luciferase constructs for normalization, an expression vector for rtTA and expression constructs for IFI16 or a vector control. Doxycycline was added to the cell culture medium to activate transcription. 40 h after transfection, a dual luciferase assay was performed and firefly luciferase activity was normalized to the corresponding Gaussia luciferase activity. The graph shows mean luciferase activity (±SEM, n=3) in the presence of IFI16 relative to the vector control (100%).
(E) HEK293T cells were transfected with expression constructs for the indicated IFI16 variants alone (1 μg) (left) or together with an expression construct for Sp1 (0.2 μg) (right). At 40 h post-transfection, nuclear proteins were isolated and equal quantities were used to determine the levels of active Sp1 using the TransAM Sp1 binding assay (ActiveMotif). Data represent mean values (± SEM) obtained from three experiments. As shown in Figure 4A, ΔPyr-li (ΔPyrin-linker) lacks the N-terminal pyrin and linker regions, while Pyr-li only encompasses these two domains.
(F) HEK293T cells were transfected with increasing doses of IFI16 expression constructs (0.004, 0.02, 0.1, 0.5, 1 and 2.5 μg). At 40 h after transfection, cells were harvested and Sp1, IFI16 and GAPDH levels determined by Western blot.
(G) HEK293T cells were transfected with expression constructs for the indicated HA-tagged IFI16 variants or a vector control. 40 h post-transfection, cells were lysed and IFI16 was immunoprecipitated using anti-HA antibodies and protein A/G magnetic beads. Proteins were blotted and stained using anti-Sp1, anti-HA and anti-GAPDH antibodies. The left panel shows one representative Western blot. The right panel shows mean Sp1 signal intensities (±SEM, n=3) after pull-down.
(H) HEK293T cells were transfected with expression constructs for HA-tagged IFI16 or a vector control. 40 h post-transfection, cells were lysed and nucleic acids were degraded by benzonase treatment before co-immunoprecipitation experiments were performed as described for (G). Left: Protein lysates were run on an agarose gel stained with ethidium bromide to confirm degradation of nucleic acids. Middle: One representative Western blot is shown. Right: Mean Sp1 signal intensities (±SEM, n=3) after pull-down. See also Figure S5.
