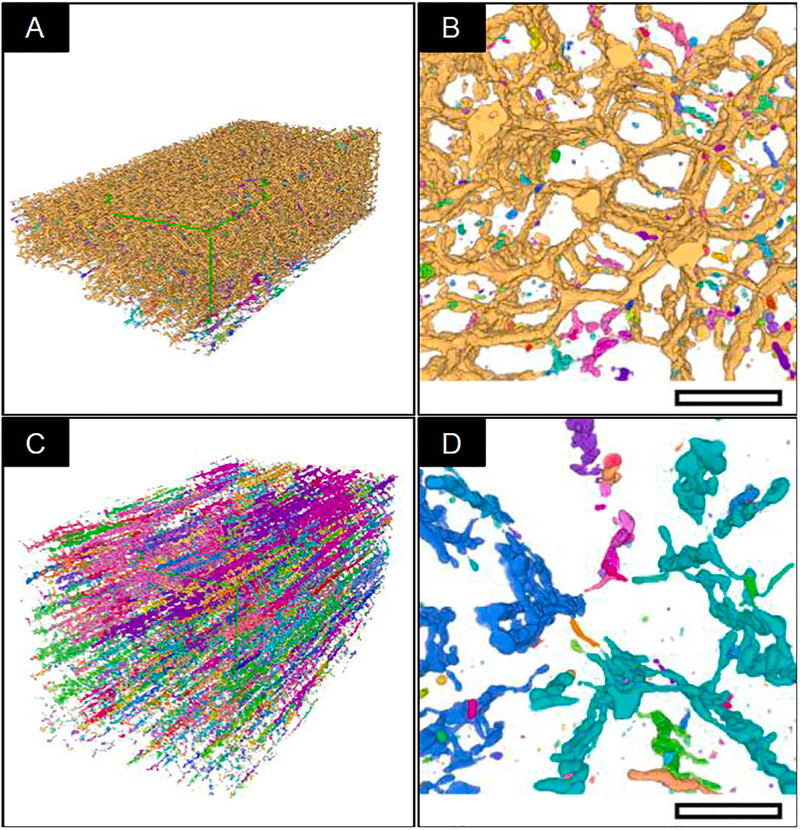
Fig. 4.
Morphological Classification. Each continuous network of connected mitochondria, as determined by ImageJ’s “MorphoLibJ” plugin, in the above images were labelled a single color. A) Typical “Type A” fiber segmentation volume. B) Transverse (X-Axis) “Type-A” image of a mitochondrial sub-volume. The majority of mitochondria in this volume are from a single network, indicated by a uniform label across the whole volume. C) Typical “Type B” fiber segmentation volume D) Transverse (X-Axis) “Type B” image of mitochondrial sub-volume. The majority of mitochondria in this volume are from multiple discontinuous networks indicated by the multi-colored labelling evident in the volume. Scale bar: 2 μm.

