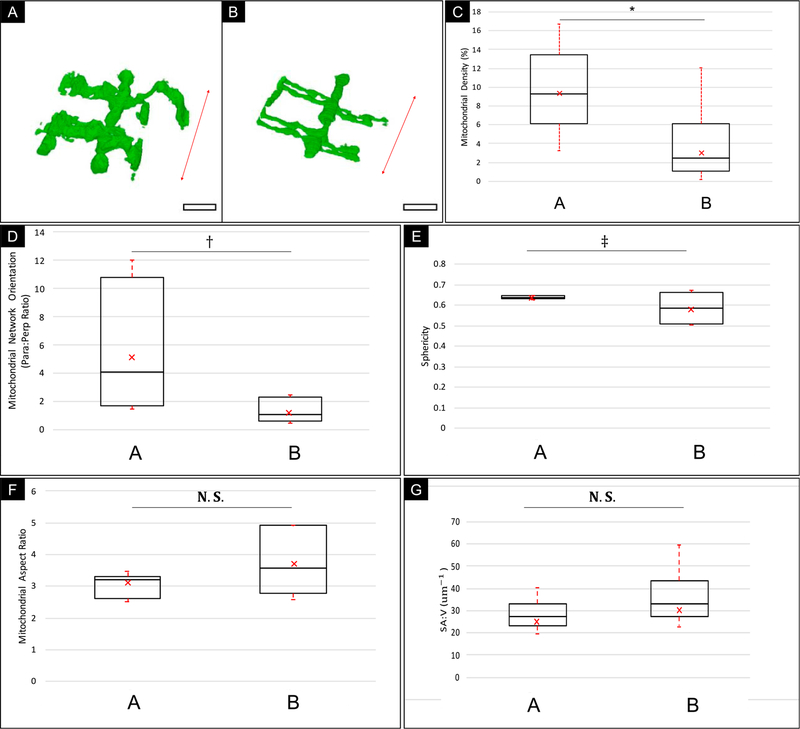
Fig. 5.
Boxplot graphical overview of Morphological Analysis of Human Skeletal Muscle Mitochondria Distribution from two sub-populations of data (Type A vs. Type B). A) Typical section of a Type A Mitochondrial Network. B) Typical Section of a Type B Mitochondrial Network; Red arrow = Orientation of fiber contraction; Scale bar: 1.5 μm. C) Mitochondrial Density Measurement. D) Mitochondrial Network Orientation. E) Mitochondrial Sphericity. F) Mitochondrial Aspect Ratio. G) Surface Area-to-Volume Ratio (SA:V). The center line indicates the median values; a × indicates the mean, the box edges depict the 5th and 95th percentiles. The error bars show the maxima and minima of each population. * indicates a statistically significant difference was found between the muscle types with high power (p-value < 0.01, α = 0.05; Power (1 – β) > 0.95). † Indicates that a statistically significant difference was found between the muscle types with moderate power (p-value < 0.01, α = 0.05; Power > 0.7). ‡ Indicates a marginal difference was found between the muscle types (p-value = 0.03, α = 0.05; Power < 0.7). N.S. indicates no statistically significant difference found between muscle types (p-value > 0.05, α = 0.05). Total Sampled volume = 343,600 μm3 across 4 healthy individuals.

