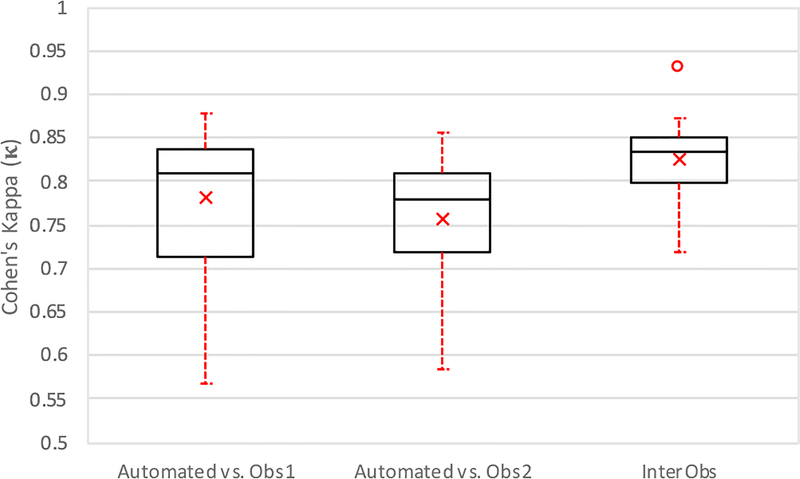
Fig. 7.
Boxplot of Quantitative Evaluation. Study of inter-observer variability and method versus each observer independently (n = 12), reported as a mean ± standard deviation. The center line indicates the median value; a × indicates the mean, the box edges depict the 25th and 75th percentiles. The error bars show the extremes at 1.5 inter-quartile range, calculated inclusive of the median, excluding outliers, indicated by °.

