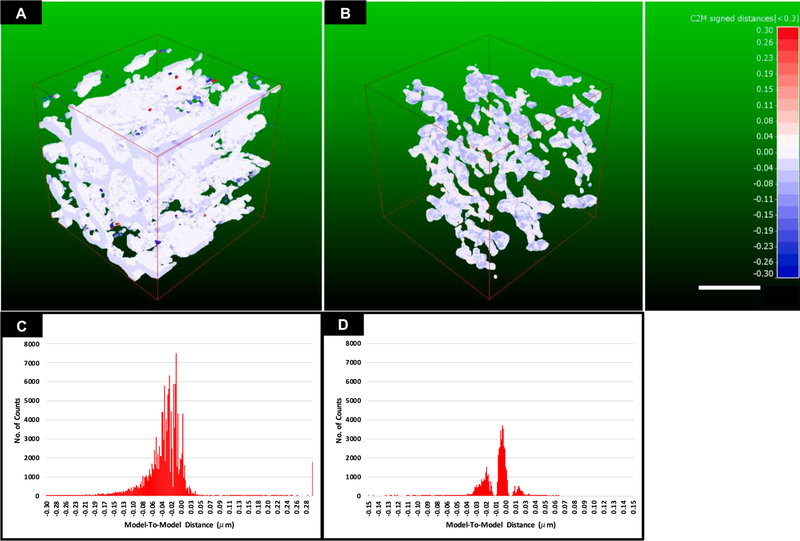
Fig. 8.
Model-to-Model Distance measurement. A) Isometric projection of 100 μm3 3D model-to-model distance map for a typical “Type A” sub-volume. B) Isometric projection of 100 μm3 3D model-to-model distance map for a typical “Type B” sub-volume. C) A graphical representation of the distribution of the mean surface distances between manual (reference) and semi-automated (comparison) volumes across the 3D mesh map for a typical type A sub-volume. D) A graphical representation of the distribution of the mean surface distances between manual (reference) and automated (comparison) volumes across the 3D mesh map for a typical type B sub-volume. Red-White-Blue distance map represents distances in microns, Red: Manual model > Automated model; White: Manual ≈ Automated model (±15 nm); Blue: Manual < Automated model. Scale bar = 2 μm.

