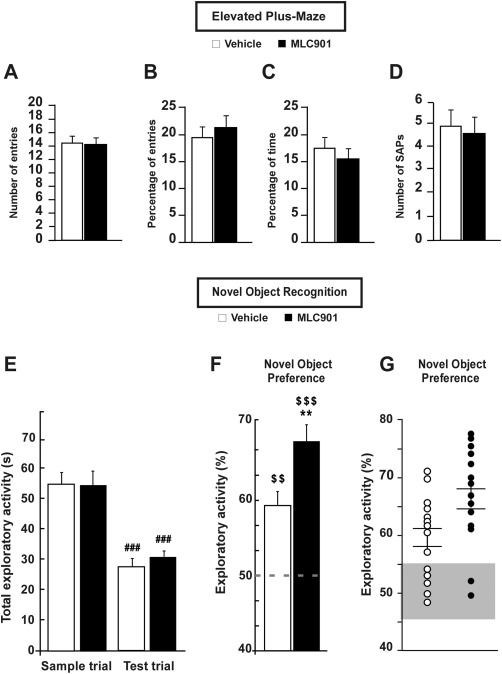
Figure 3.

Effect of MLC901 in the elevated plus‐maze and novel object recognition tests. A: Elevated plus maze; number of entries in the closed arms ± SEM. B: Elevated plus maze; entries in the open arms in percentage ± SEM. C: Elevated plus maze; time spent in the open arms in percentage ± SEM. D: Elevated plus maze; number of SAPs achieved ± SEM. E: Novel object recognition; time spent to explore both objects in seconds ± SEM. ### P < 0.001, comparison between the sample and the test trials in both groups. F: Novel object recognition; exploratory activity devoted to the novel object in percentage ± SEM. Dotted line represents the chance level (50% of the exploratory activity). $, comparison with the chance level; *, comparison between the vehicle‐treated and MLC901‐treated groups. Double symbols, P < 0.01; triple symbols, P < 0.001. G: Novel object recognition; individual plots for the exploratory activity devoted to the novel object in percentage ± SEM. Whiskers indicate mean ± the SEM. Gray area marks the 45–55% interval of the total exploratory activity devoted to the novel object.
