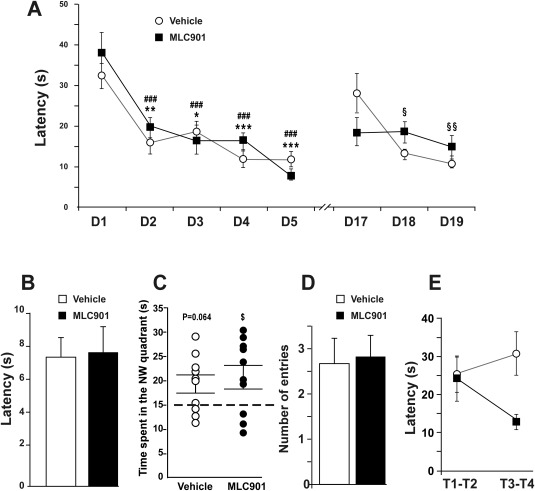
Figure 4.

Effect of MLC901 in the Morris water maze test. A: Evolution of the daily average of the latency before reaching the platform over the learning trials (D1–D5) and the relearning trials (D17–D19) in seconds ± SEM. *, comparison with the score performed on the first day of learning (D1) in the vehicle‐treated group; #, comparison with the score performed on the first day of learning (D1) in the MLC901‐treated group; §, comparison with the score performed on the first day of relearning (D17) in the vehicle‐treated group. Single symbol, P < 0.05; double symbols, P < 0.01; triple symbols, P < 0.001. B: Latency before reaching the platform (averaged over four trials) during the cue test in seconds ± SEM. C: Time spent in the NW quadrant during the probe test in seconds ± SEM. Dotted line represents the chance level. $ P < 0.05 compared with the chance level. D: Number of crossings of the previous platform location ± SEM. E: Evolution of the latency before reaching the platform during the first day of the relearning (D17) in seconds ± SEM. T1–T2, average of the two first trial performances; T3–T4, average of the two last trial performances.
