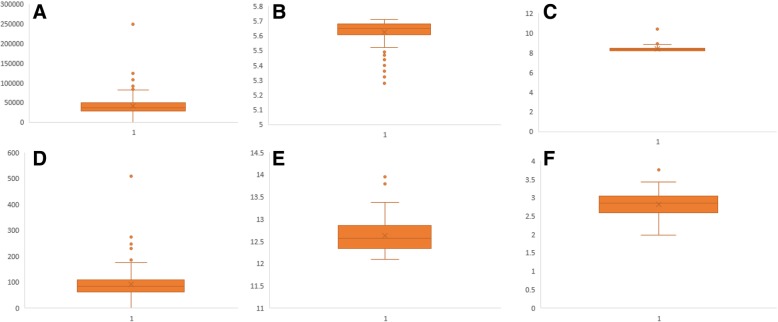
Fig. 1.
Box and Whisker plot of (a) average number of protein sequences encoded in plant proteome, b average acidic pI, c average basic pI of plant proteome, d average number of neutral pI proteins per plant proteome (e) average of highest pI protein, and (f) average of lowest pI proteins. Details can be found in Additional file 2: Table S1

