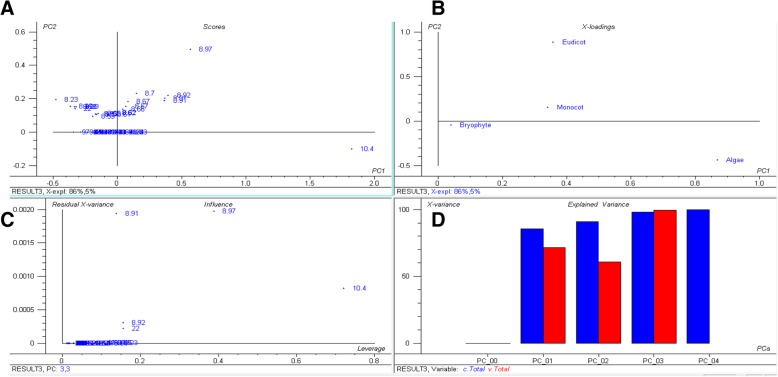
Fig. 3.
Principal component analysis (PCA) of basic pI proteins. The PCA plot illustrates that the basic pI of algae, bryophytes, eudicots, and monocot plants cluster distinctly from each other and that there is no lineage-specific correlation with basic pI proteins. In the figure (a) scores: show the similarities in sample grouping, (b) loading: represents the relative position of a variables and how it relates the samples to the different variables (c) Influence plot: represents the Q- or F-residuals vs. Leverage or Hotelling T2 statistics that show the residual statistics on the ordinate axis of sample distance to model, and (d) variance: represents the variation in the data described by the different components. Total residual variance is computed as sum of square of residuals for all the variables, divided by the number of degrees of freedom. The green colour indicates the calibration and the red indicates the validation

