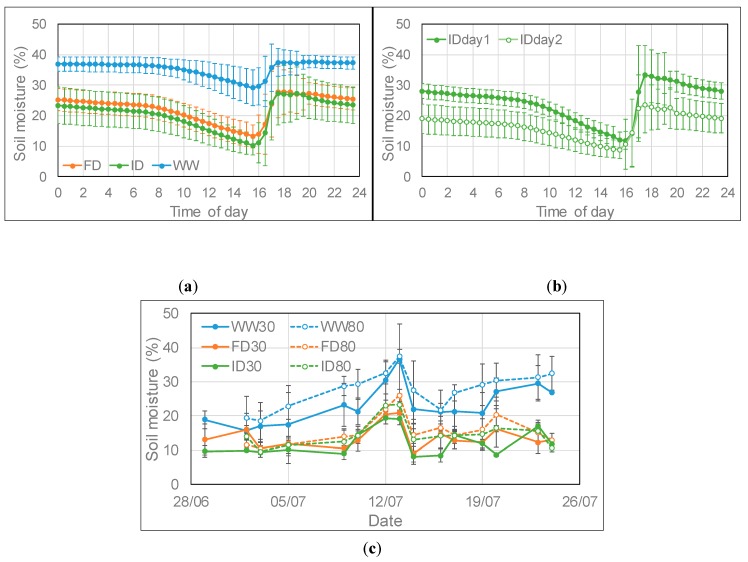
Figure 1.
Average (± SD) daily profile of soil moisture content at low ozone (O3) (a) at three irrigation regimes (n = 27 (days)), (b) at ID irrigation on day 1 (full watering; n = 13 (days)) and day 2 (very limited watering; n = 14 (days)) and (c) average (± SD; n = 4) soil moisture content at low and high O3 between 14:30 and 15:00 at three watering regimes for the period 26 June–23 July 2018, with high O3 exposure starting on 28 June. Wheat plants were watered between 15:30 and 17:30; WW = well-watered; FD = frequent deficit irrigation; ID = infrequent deficit irrigation; 30 = peak O3 concentration of 30 ppb; 80 = peak O3 concentration of 80 ppb.

