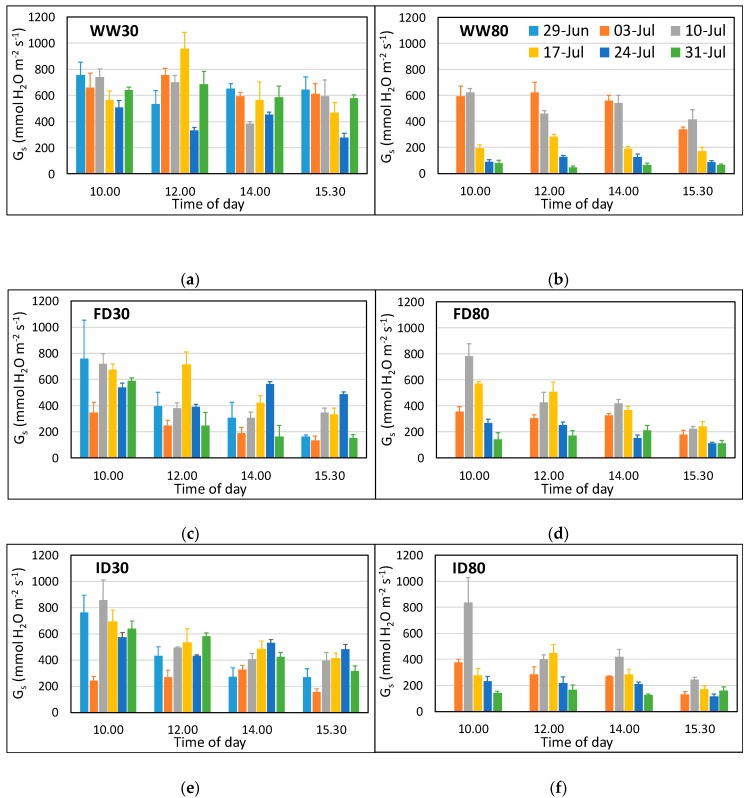
Figure 2.
Stomatal conductance (gs) of the flag leaf wheat at low (a,c,e) and high (b,d,f) O3 concentrations and three irrigation regimes between 29 June (only measured at low O3) and 31 July at four different times of the day. The treatments were applied for the period 26 June–23 July 2018, with high O3 exposure starting on 28 June. Data for 29 June were not included in the statistical analysis as they were only obtained for low O3. WW = well-watered (a,b); FD = frequent deficit irrigation (c,d); ID = infrequent deficit irrigation (e,f), with low volume applied on the day before 29 June, 3 July, and 24 July; 30 = peak O3 concentration of 30 ppb; 80 = peak O3 concentration of 80 ppb. Values are averages (± SE; n = 4).

