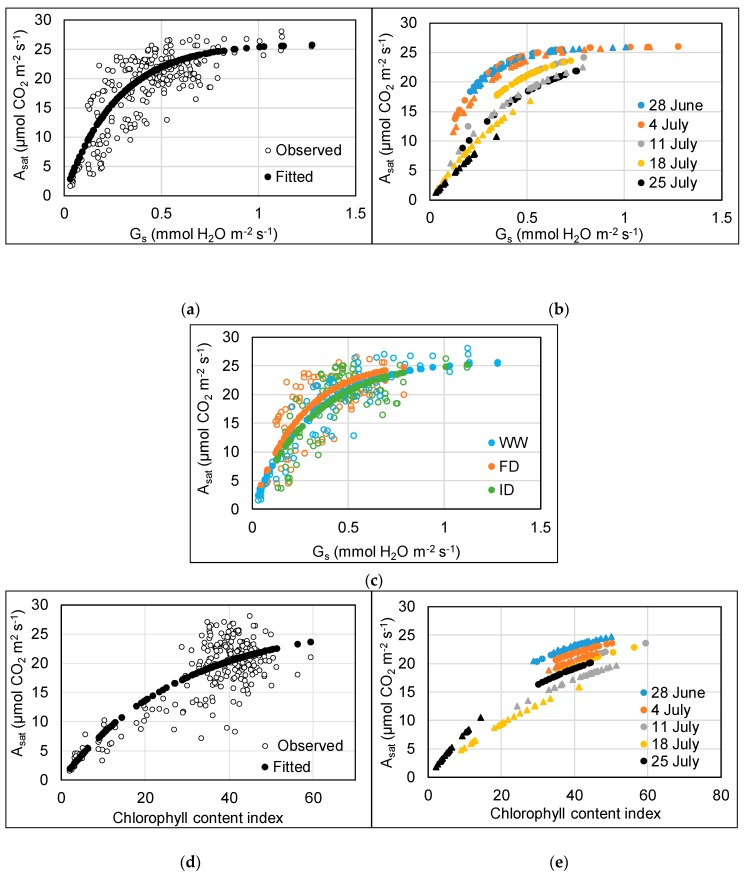
Figure 4.
Relationship between Asat and gs (a–c) and CCI (d,e) of the flag leaf of wheat between 28 June and 25 July. For plots a, c, d, filled circles show the model fitted values (for fixed effects), and empty circles show the observed data. For plots b, e, these are modelled fitted values at different dates; circles = low O3, triangles = high O3.

