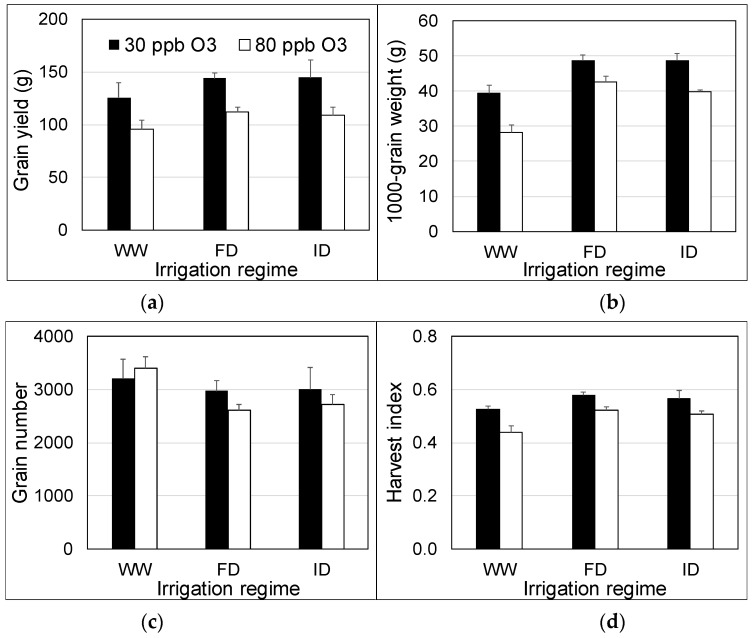
Figure 5.
Yield ((a) grain yield, (b) 1000-grain weight, (c) grain number), and harvest index (d) of wheat at 30 and 80 ppb peak O3 concentrations and three irrigation regimes applied between 26 June and 23 July 2018. WW = well-watered; FD = frequent deficit irrigation; ID = infrequent deficit irrigation. Values are averages (±SE; n = 4).

