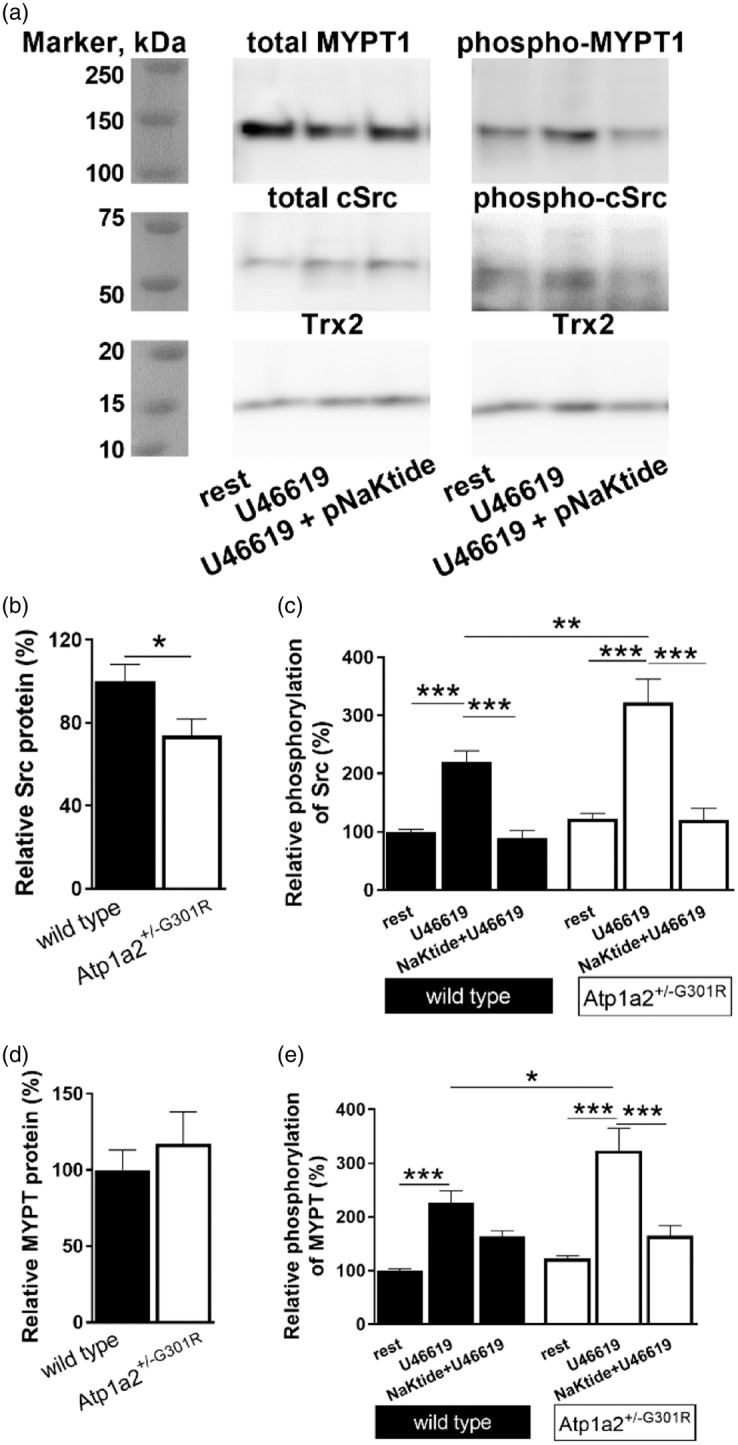
Figure 7.

Semi-quantitative analyses of expression and phosphorylation of cSrc kinase and MYPT1 proteins in middle cerebral arteries from Atp1a2+/−G301R and WT mice. Representative WT Western blot where MYPT 1 and cSrc expression and phosphorylation were studied (a). Thioredoxin 2 (Trx2) was used as loading control. Total cSrc kinase expression (normalized to Trx2 band density) was reduced in cerebral arteries from Atp1a2+/−G301R compared to WT mice (b; n = 6–9). Averaged results suggest an increased cSrc phosphorylation (calculated as a ratio between phosphorylated and total cSrc, and normalised to averaged values for WT under resting conditions) in arteries from Atp1a2+/−G301R mice compared to WT after U46619 (10−5 M) stimulation (C; n = 5–11). Incubation with pNaKtide (2 µM) abolished this difference. Expression of total MYPT1 (normalized to Trx2 band density) was not different between the groups (n = 4–12; d, representative Western blot; e, averaged data). U46619 significantly increased MYPT1 phosphorylation at Thr850 (n = 4–12; f) (calculated as a ratio of phosphorylated and total MYPT1, and normalised to averaged values for WT under resting conditions). This potentiation is stronger in cerebral arteries from Atp1a2+/−G301R than WT. In the presence of pNaKtide this potentiation was abolished, and there was no difference between arteries from Atp1a2+/−G301R and WT. *, ** and ***, P < 0.05, < 0.01 and < 0.001 (two-way ANOVA).
