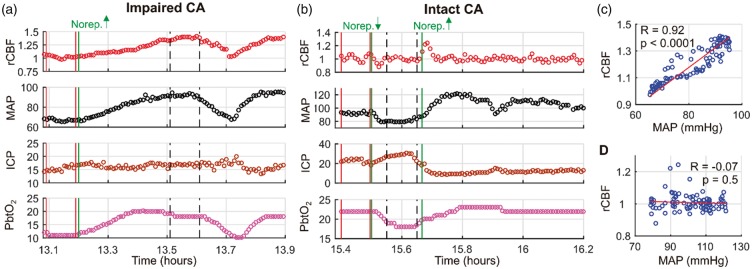
Figure 4.
Temporal non-invasive neurometabolic optical monitor (NNOM) measurements of relative cerebral blood flow (rCBF ≡ CBF/CBFo) with concurrent mean arterial pressure (MAP, mmHg), intracranial pressure (ICP, mmHg), and brain interstitial oxygen tension (PbtO2, mmHg) data acquired during MAP manipulations performed on “measurement day 1” (a) and “measurement day 2” (b) in subject #5 (diagnosed with traumatic brain injury, see Table 1). CBFo is the (baseline) mean value of the data between the two vertical red lines. MAP was significantly altered via adjustment of norepinephrine infusion (vertical green lines: the increase from 2 to 4 mcg/kg/min in panel (a); the decrease from 4 to 2 mcg/kg/min, followed by the increase from 2 to 4 mcg/kg/min in panel (b)). The vertical dashed black lines indicate the 6-min intervals used to compute the steady-state changes relative to baseline that are shown in panels (d) and (e) of Figure 5. (c) rCBF plotted against concurrent MAP data for the entire temporal interval shown in panel (a). The high Pearson’s correlation coefficient (i.e., DCSx = 0.92, p < 0.0001) indicates impaired cerebral autoregulation (CA). (d) rCBF plotted against concurrent MAP data for the entire temporal interval shown in panel (b). The lack of correlation (i.e., DCSx = −0.07, p = 0.5) indicates intact CA. The analogous pressure reactivity autoregulation indices (PRx) for the data in panels (a) and (b) are −0.10 (p = 0.34) and −0.92 (p < 0.0001), respectively (note, although the PRx value for panel (a) is negative, the p value indicates the correlation is not significant). The analogous brain tissue oxygen pressure reactivity autoregulation indices (ORx) are 0.80 (p < 0.0001) and 0.69 (p < 0.0001), respectively. Thermal diffusion flowmetry data were not available during these CA assessments.

