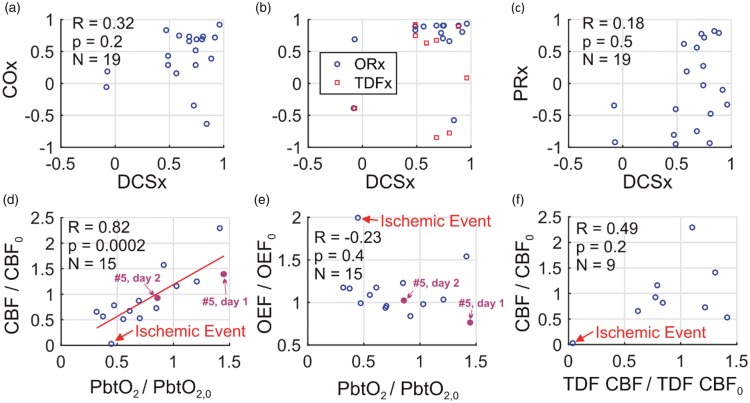
Figure 5.
During non-invasive neurometabolic optical monitoring, significant mean arterial pressure (MAP) changes were induced 19 times by standard-of-care adjustment in vasoactive medication infusion rates. DCSx, COx, ORx, TDFx, and PRx cerebral autoregulation (CA) indices were computed across the 50-min intervals encompassing the infusion changes (see text). These five indices are, respectively, the Pearson correlation coefficients between: (1) optical diffuse correlation spectroscopy (DCS) cerebral blood flow (CBF) index and mean arterial pressure (MAP); (2) optical time-resolved near-infrared spectroscopy (TR-NIRS) measurement of cerebral tissue oxygen saturation and MAP; (3) brain interstitial oxygen tension (PbtO2) and cerebral perfusion pressure (CPP); (4) thermal diffusion flowmetry (TDF) CBF and CPP; and (5) MAP and intracranial pressure. (a) COx plotted against DCSx; (b) ORx (blue circles) and TDFx (red squares) plotted against DCSx; and (c) PRx plotted against DCSx. In most cases, the DCSx, COx, ORx, and TDFx indicate impaired CA. The PRx, however, is more variable. Steady-state PbtO2 changes resulting from the infusion changes were correlated with DCS measured CBF changes (equation (3)) (d), but not with TR-NIRS measured OEF changes (equation (2)) (e). Steady-state DCS measured CBF changes were not correlated with TDF CBF changes (f). In panels (d) through (f), the baseline and perturbed data are 6 min averages across stable data acquired shortly before and shortly after the pressor infusion rate changes (e.g., see Figure 4). The red line in panel (d) is the linear best-fit line. One event of cerebral ischemia (i.e., PbtO2 < 20 mmHg, TDF CBF < 15 ml/100 g/min, cerebral microdialysis lactate:pyruvate ratio > 40) accompanied a drop in phenylephrine infusion (labeled in panels (d), (e), (f); temporal data in Figure 2). For subject #5, DCSx indicated impaired CA day 1 (DCSx = 0.92), and intact CA day 2 (DCSx = −0.07; MAP challenges labeled in panels (d), (e); temporal data in Figure 4).

