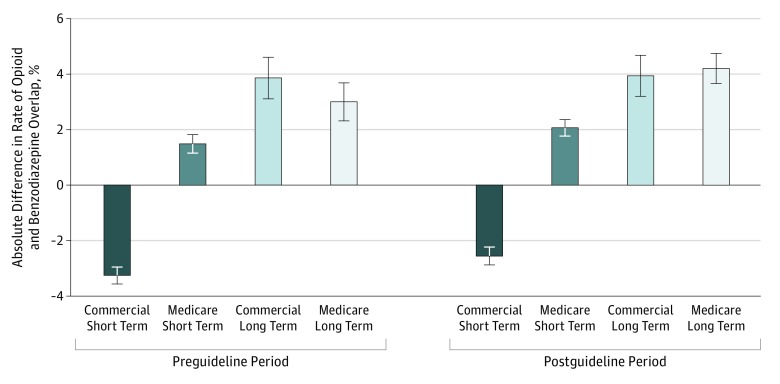
Figure 3. Difference in Intensity With Same vs Different Physicians Prescribing Opioids and Benzodiazepines.
Error bars denote 95% confidence intervals, and column height indicates the percentage point increase in the rate of coprescribing (overlap days in month per opioid prescription days in month). For example, in the commercial population using long-term opioids before the guideline release, the regression-adjusted proportion of opioid prescription days with overlapped benzodiazepines was 80.5% with the same physician prescribing and 76.6% with different physicians prescribing. The absolute difference is 80.5% − 76.6% = 3.9%. All differences were statistically different from 0 when adjusted for a familywise error rate of 0.05. Point estimates and differences with 95% confidence intervals are provided in eTable 15 in the Supplement.

