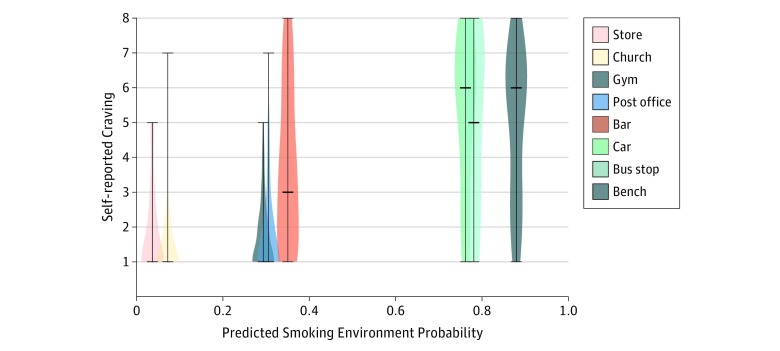
Figure 3. Model Predictions vs Self-reported Craving.
The distribution of self-reported for each of the images of typical daily environments viewed by participants. Horizontal bars indicate the median, lowest, and highest values reported. The x-axis placement indicates the probability that the image represents a smoking environment, as predicted by the model.

