Figure 2.
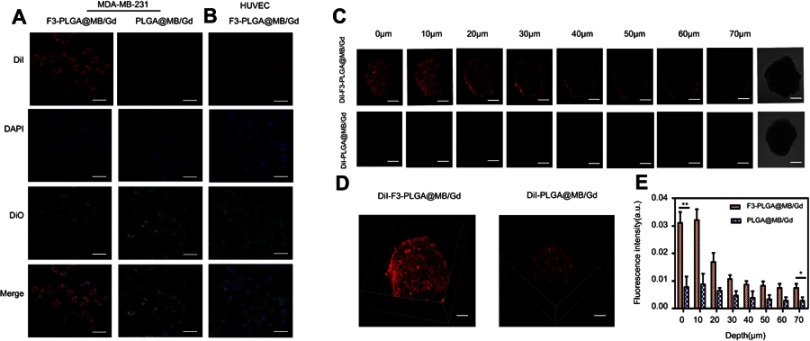
(A) CLSM images of MDA-MB-231 cells incubated with Dil-labeled F3-targeted NPs and non-targeted NPs. From top to bottom are DiI-labeled nanoparticles, the DAPI-labeled nuclei, DIO -labeled cytolemma and their overlay, scale bar: 50 μm. (B) CLSM images of HUVEC cells incubated with Dil-labeled F3-targeted NPs. (C) Multi-level scan at 10 μm intervals for the penetration of Dil-F3-PLGA@MB/Gd NPs and Dil-PLGA@MB/Gd NPs(left) and confocal images of MDA-MB-231 tumor spheroids (right). Scale bar: 250 μm. (D) 3D-reconstruction of the MDA-MB-231 tumor spheroids in the Dil-F3-PLGA@MB/Gd group and DiI-PLGA@MB/Gd group. (E) Quantitative analysis of fluorescence intensity value in F3-targeted group and non-targeted group (*P<0.05, **P<0.01).
Abbreviations: CLSM, confocal laser scanning microscope; NPs, nanoparticles; HUVEC, human umbilical vein endothelial cells; PLGA, poly(lactide-co-glycolic acid); MB, Methylene blue; Gd, gadodiamide;3D, three-dimensional.

