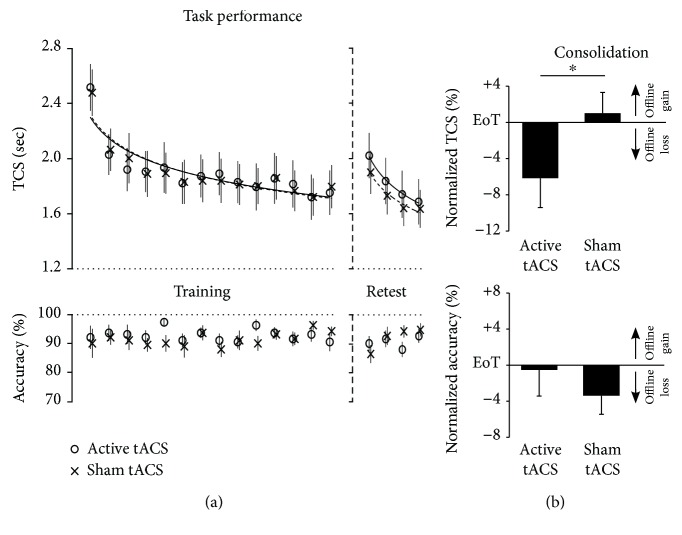
Figure 2.
Behavioural results: posttraining active vs. sham 10 Hz (alpha) tACS. (a) Task performance. Mean time to perform a correct sequence per block (TCS) and percentage of correct sequences per block (accuracy) across blocks of training (14 blocks) and delayed retesting (four blocks). Vertical bars represent the standard error of the mean (SEM). (b) Consolidation. Columns represent the mean of normalized speed (TCS) and normalized accuracy performance across the four blocks of delayed retesting, i.e., performance changes relative to the individual “end-of-training performance” (EoT, average PI of last two blocks of training). Positive values indicate offline improvements of speed and accuracy performance (offline gains), while negative values indicate performance decrements (offline loss) relative to EoT. Bars represent SEM. ∗ indicates significant difference of consolidation (p < 0.05).

