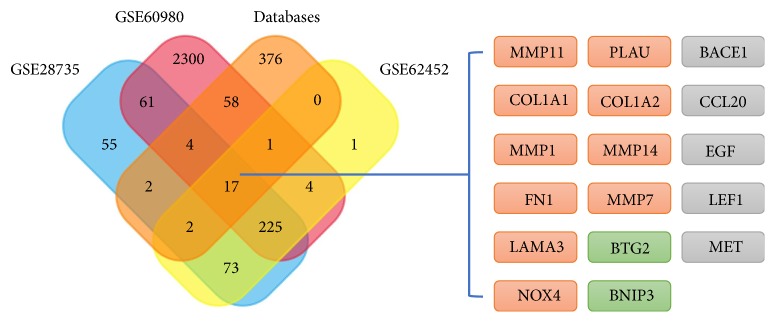
Figure 5.
Venn analysis of the differentially expressed genes. The Venn diagram shows 17 genes mentioned in both the databases and 3 microarray projects. Among these 17 genes, MMP1, MMP7, MMP11, MMP14, COL1A1, COL1A2, FN1, LAMA3, NOX4, and PLAU are highly expressed in PDAC tissues (marked as orange, round rectangles); BTG2 and BNIP3 are weakly expressed in PDAC tissues (marked as green, round rectangles); BACE1, CCL20, EGF, LEF1, and MET are not expressed in pancreatic tumor according to the NCBI-UniGene database (marked as gray, round rectangles).

