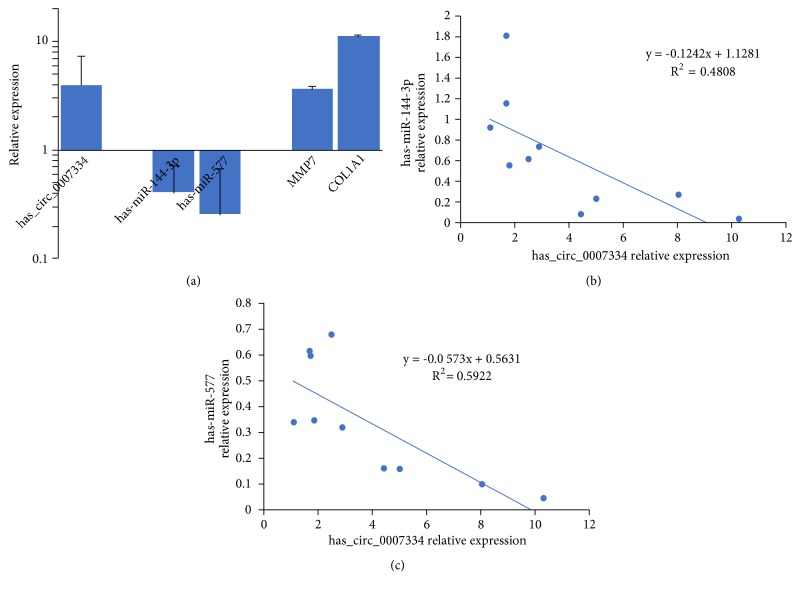
Figure 8.
Expression profiles of the miRNAs hsa-miR-144-3p and hsa-miR-577 and MMP7 and COL1A1 mRNAs in PDAC. (a) The expression levels of the circRNA hsa_circRNA_0007334, the miRNAs hsa-miR-144-3p and hsa-miR-577, and MMP7 and COL1A1 mRNAs were analyzed by the 2−ΔΔCt method using RT-qPCR. The x-axis presents the genes. The y-axis presents the relative expression level, and a relative expression level higher than 1.00 indicates that it is upregulated. In PDAC tissues, compared with adjacent nontumor tissues, a relative expression level lower than 1.00 indicates that it is downregulated. (b) Two-tailed Pearson's correlation analysis of the relationship between hsa_circRNA_0007334 and hsa-miR-144-3p expression. (c) Two-tailed Pearson's correlation analysis of the relationship between hsa_circRNA_0007334 and hsa-miR-577 expression.

