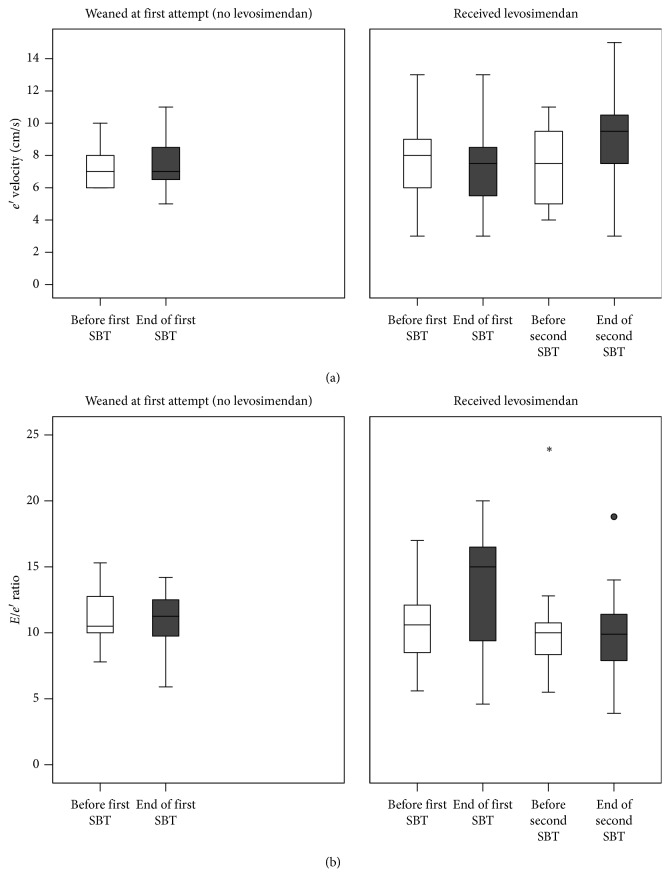
Figure 2.
Tissue Doppler e′ wave (a) and E/e′ ratio (b) before (white boxes) and at the end (grey boxes) of SBTs in successfully weaned patients (left panel) and in those who failed and received levosimendan (right panel). After levosimendan administration, end-SBT e′ velocity increased and the E/e′ ratio was maintained constant throughout the SBT, whereas it had increased during the first SBT.

