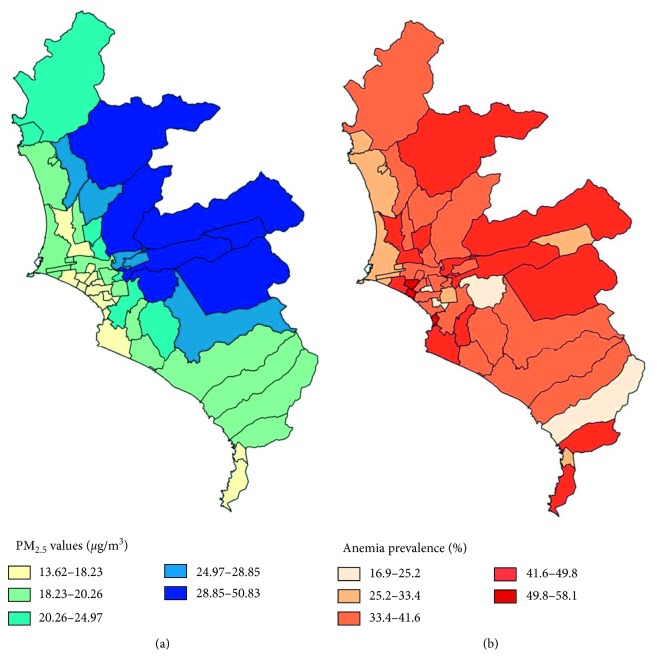
Figure 1.
(a) Average PM2.5 concentration by district. 15 districts fall in the 1st quintile (1Q), 11 in the 2Q, 6 in the 3Q, 5 in the 4Q, and 7 districts in the 5Q. (b) Anemia prevalence in children aged 6–59 months during the period of the study (2012–2016). 4 districts fall in the 1Q, 6 in the 2Q, 19 in the 3Q, 12 in the 4Q, and 3 districts in the final quintile.

