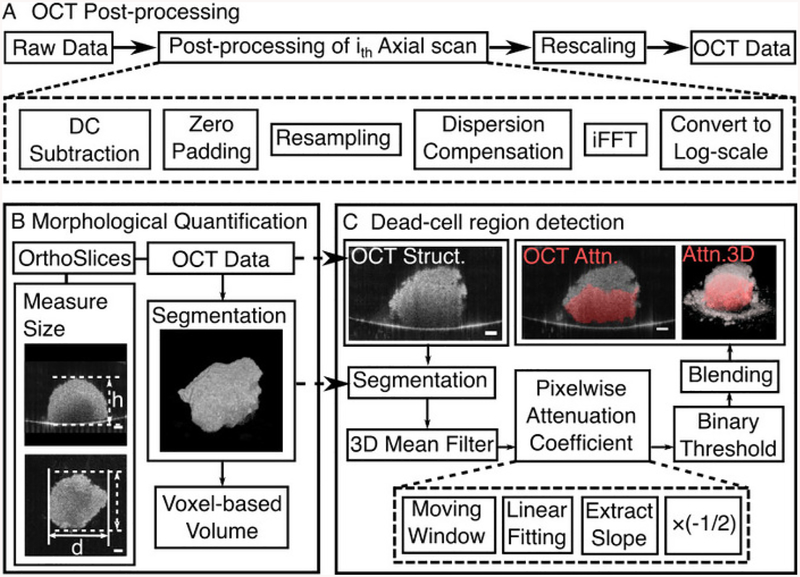
Figure 2: Data Processing for OCT images of tumor spheroids.
(A) Flowchart of general post-processing steps for OCT data. (B) Flowchart of morphological quantification of the tumor spheroid. (C) Flowchart of dead cell region detection of the tumor spheroid. Scale bar: 100 μm for all the subfigures. Please click here to view a larger version of this figure.

