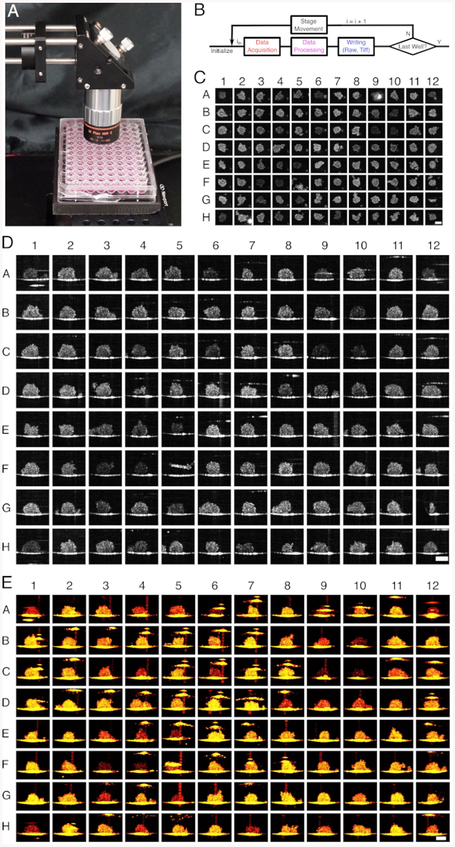
Figure 3: High-throughput OCT scanning of a 96 well plate containing U-87 MG tumor spheroids.
(A) The actual setup with the 96-well plate under the objective. (B) Flow Chart of the software implementation of HT-OCT system. Collages of 96 en face (C), cross-sectional (D) and 3D rendered maximum intensity projection (MIP) (E) OCT images of Day 3 HCT 116 spheroids were generated from the processed data. Scale Bar: 200 μm for all the subfigures. Please click here to view a larger version of this figure.

