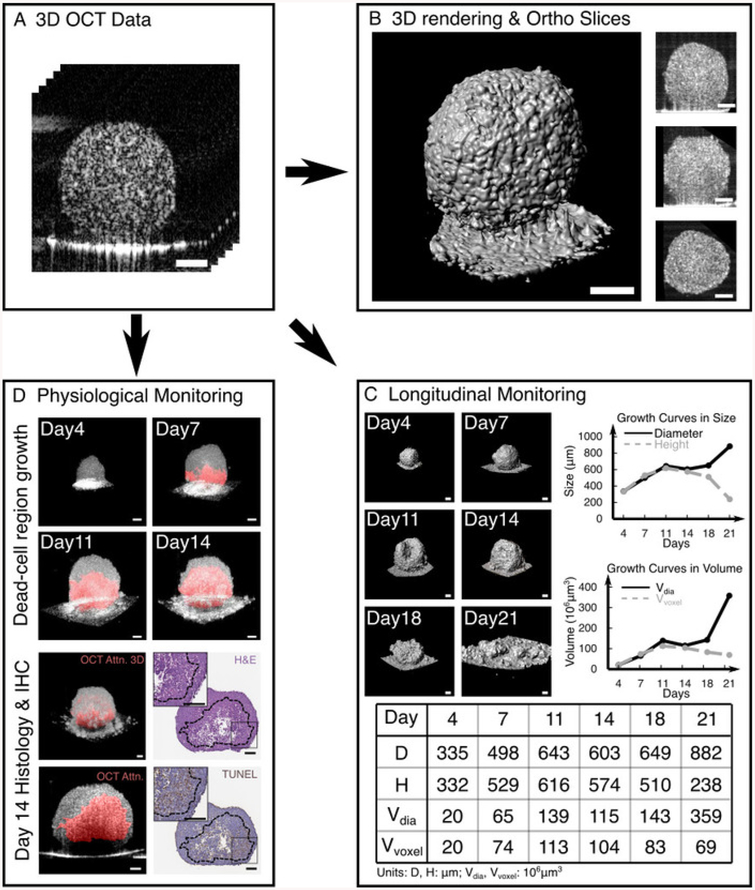
Figure 4: Longitudinal Morphological and Physiological Quantification of Tumor Spheroids with 3D OCT data.
(A) Obtained 3D OCT structural images of a tumor spheroid after general OCT post-processing. From the OCT data, we can generate a 3D surface plot and XZ, YZ and XY orthogonal slices to visualize the structure of the tumor spheroid in any direction (B). We can perform longitudinal monitoring of a single tumor spheroid (C), characterizing its diameter, height and voxel-based volume (listed in the Table of Materials) and plotting the growth curves in size and volume during the 21-day development. In the example, as the spheroid developed, it became disrupted on day 11 and fully collapsed on day 21. We can further monitor the physiological status of a tumor spheroid longitudinally based on the optical intrinsic attenuation contrast (D). 3D rendered images of a tumor spheroid showed the appearance and growth of dead-cell regions from day 7 to day 14. The high-attenuation-labeled dead-cell areas in red were matched with histological and immunohistochemical (IHC) results. OCT attenuation map, H&E, and TUNEL result in Figure 4D are modified from Ref. 42. Scale bars: 100 μm for all the subfigures. Please click here to view a larger version of this figure.

