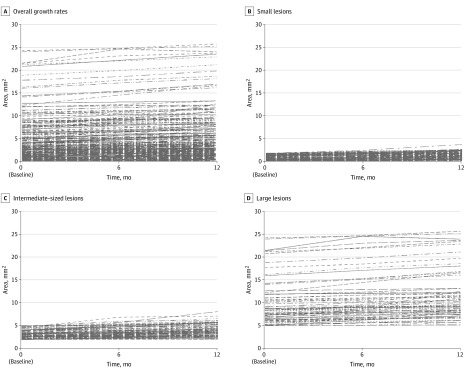
Figure 2. Estimated Growth Rates of Lesions of Definitely Decreased Autofluorescence.
Estimated growth rates of lesions of definitely decreased autofluorescence are shown as overall growth rates (A) and subgroups of lesion size at baseline: small lesions (≤1.90 mm2) (B); intermediate-sized lesions (>1.90-5 mm2) (C), and large lesions (>5.0 mm2) (D).

