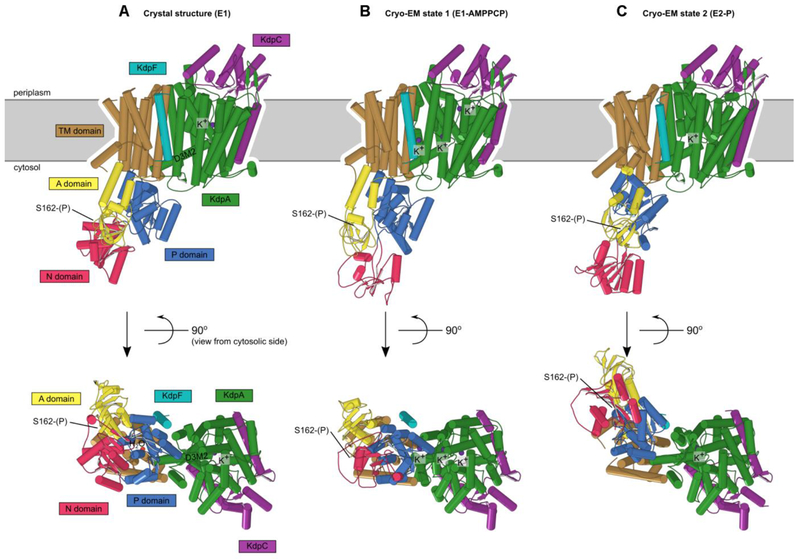
Figure 7:
Comparison of KdpFABC structures. (A) X-ray crystal structure. (B) State 1 from cryo-EM. (C) State 2 from cryo-EM. Only minor changes were observed in KdpA, KdpC and KdpF. However, the arrangements of N, P and A domains of KdpB have significant differences in E1-like states and the E2-P state. The apparent loss of secondary structure in the N-domain from the cryo-EM state 1 is likely to be an artifact of the real-space fitting to the relatively low resolution densities in this region of that map.

